Curated OER
Highs and Lows
Students use email to chart weather patterns and then graph their findings. In this weather patterns instructional activity, students chart their weather for a week at the school. Students then use email to find temperatures at a variety...
Curated OER
Observing Fall Migrants
Students keep a detailed data collection log of the different types of monarch behavior. They track the weather conditions daily and link it to the migration of the monarchs. They summarize their data using either a graph or a computer...
Curated OER
Sweethearts and Data Analysis
Students explore the concept collecting and representing data. In this collecting and representing data instructional activity, students record the different colors of sweetheart candies in their sweethearts box. Students create a table...
Curated OER
Bar Me In
Fourth graders watch a video about constructing bar graphs. They create their own graph and interpret it.
Curated OER
Using My Nasa Data To Determine Volcanic Activity
Young scholars use NASA satellite data of optical depth as a tool to determine volcanic activity on Reunion Island during 2000-2001. They access the data and utilize Excel to create a graph that has optical depth as a function of time...
Curated OER
Predicting Temperature: An Internet/Excel Learning Experience
Third graders use the Internet (www.weather.com) to find the high temperature for our locale and the high temperature for another city around the world. They keep track of the temperature in these two locations for 10 days.
Curated OER
Surface Meteorological Observation System (SMOS)
Young scholars investigate local surface weather conditions. They log weather conditions for thirty days, develop a graph, plot cloud cover, and compare/contrast the graphed lines of various weather factors.
Curated OER
Picnic Possibilities
Fourth graders plan a picnic using weather data. Using accumulated weather data from various sources, they create a graph of the weather conditions in their region for a given period of time. Students interpret this data to predict the...
Curated OER
Teach it to me - Seasonal Calendar
Students document the weather. In this seasons instructional activity, students study the weather, record the temperature outside and photograph what the weather conditions look like. All information gathered by the students will be made...
Curated OER
Climate Types
In this weather worksheet, students describe the rainfall distribution found in two different areas of the world. Then they compare the various types of climates found around the world using the graphs shown on the sheet.
Curated OER
Fall is All Around Us
Pupils develop and create a production company and produce a fall event that demonstrates what they have learned in various subject areas. STudents create stories, complete a venn diagram comparing fall and summer, graph and measure...
Curated OER
Countdown to Disaster
Students discover the potential dangers of weather in their hometown. In this environmental lesson, students research Hurricane Hugo and the devastation it caused South Carolina in 1989. Students record weather data from...
Curated OER
Can You Name the Four Seasons?
Students explore names, characteristics and traditions of the seasons and observe weather changes throughout the year.
Curated OER
Martian Sun Times
Students become weather reporters for the Martian Sun Times newspaper to gather. interpret, and compare current weather information for Mas and Earth. Final articles be posted on-line. There are seven investigations in this unit.
Curated OER
What is Climate?
Students explore the differences between climate and weather. In this introductory lesson plan of a climate unit, students discuss the vocabulary and concepts associated with weather and climate. They build their information base for...
Curated OER
Structure of the Earth
Seventh graders study the cause of climate change, and how clouds form and affect weather. They define condensation and precipitation, the greenhouse effect and the water cycle.
Curated OER
Jumping to Conclusions
Students decide as a class what their data is going to be to graph. In this math lesson, students organize data so that it will be easier to display in a graph. Students are guided through the process by their teachers, and helped with...
Curated OER
Surface Air Temperature Trends of the Caribbean
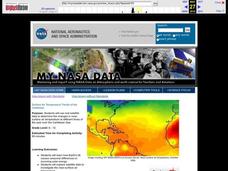
Students investigate the seasonal changes to sea surface and near-surface air temperatures near the equator. They use actual satellite data to track and graph the differences in air and sea temperatures during different seasons in the...
Curated OER
Creeping
Students observe, measure, and graph a model of slow down slope movement representing soil creep. This task assesses students' abilities to collect, record, and organize data, set up graph axes, plot data points, draw line graphs, apply...
Curated OER
The Effect of Rain on Morning Temperatures
Eighth graders study the effects of the water cycle. They create a graph of the air temperature versus solar radiation on a rainy and clear 24 hour period using data from a provided link. Afterward, they answer questions to determine the...
Curated OER
Fourth Grade Science Quiz
In this science instructional activity, 4th graders take a multiple choice quiz about the weather, moon, electricity, and more. Students complete 15 questions total.
Curated OER
Ocean Botttom Profile
Students interpret a graph of ocean depths and topographic features. This task assesses students' abilities to interpret figures, organize and represent data, apply knowledge of scale to a profile, and apply theoretical knowledge.
Curated OER
Hurricanes and Climate
Students investigate maps and data to learn about the connections between hurricanes and climate. In this exploratory activity students describe and graph the 6 regions where hurricanes happen and discuss how hurricanes have changed over...
Curated OER
How's the Weather
"How's the Weather?" is an exercise that combines science and math as students graph the weather along the Iditarod Trail. They complete a double-line graph of the weather of a chosen checkpoint over the course of one week. Students...
Other popular searches
- Weather Graph
- Kindergarten Weather Graph
- Fall Weather Graph
- Daily Weather Graph
- Culture Weather Graph
- Graph Weather Chart
- Weather Graph Template
- Weather Graph Paper
- Math Data Graph Weather
- Weather Graph 1st Grade
- Local Weather Graph
- Local Weather Line Graph

