Willow Tree
Graphing
So many methods and so little time! The efficient method of graphing a linear equation depends on what information the problem gives. Pupils learn three different methods of graphing linear equations. They graph equations using...
Mt. San Antonio Collage
Quadratic Functions and Their Graphs
Starting with the basics, learners discover the features of a parabola and the ways to accurately graph it. After pupils practice with graphing, the end of the worksheet focuses on application type problems.
Willow Tree
Equations of a Line
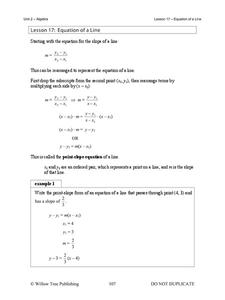
Each form of a linear equation has its purpose — pupils just have to find it. Building on the previous lesson in the series, learners examine point-slope and standard form. Using point-slope form, pupils write the equation of a...
Willow Tree
Linear Relationships
There's just something special about lines in algebra. Introduce your classes to linear equations by analyzing the linear relationship. Young mathematicians use input/output pairs to determine the slope and the slope-intercept formula to...
Willow Tree
Slope
Investigate the different types of slope using graphs and ordered pairs. Scholars use the slope formula to determine the slope of a line between two points. Includes examples with a slope of zero and with no slope. The lesson follows a...
Del Mar College
All About Lines
This resource should be called "All About Lines, and Then Some!". Packed full of all the key components of linear functions, learners review how to set up different equations, find intercepts, and graph. All the main topics are included...
Willow Tree
Approximating a Line of Best Fit
You may be able to see patterns visually, but mathematics quantifies them. Here learners find correlation in scatterplots and write equations to represent that relationship. They fit a line to the data, find two points on the line, and...


