Curated OER
Graphs of Quadratic Functions Section 11.6
In this graphing worksheet, pupils graph quadratic functions. They identify the maximum and minimum value of the function, determine the line of symmetry, and locate the vertex. Coordinate planes are provided for each function. There are...
Alabama Learning Exchange
We Love to Graph!
Students experience graphing points. For this graphing points lesson, students play an on-line game where they must name 10 coordinate pairs correctly. Students play a maze game where they maneuver a robot using coordinate...
Illustrative Mathematics
Graphs of Quadratic Functions
The equations look different, but their graphs are the same. How can that be? This activity leads your mathematicians in an exploration of three different forms of the same quadratic function. After comparing the equations, their graphs,...
Willow Tree
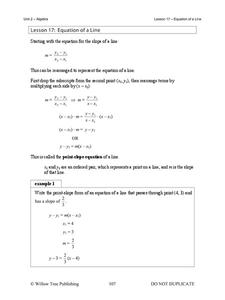
Equations of a Line
Each form of a linear equation has its purpose — pupils just have to find it. Building on the previous lesson in the series, learners examine point-slope and standard form. Using point-slope form, pupils write the equation of a...
Mt. San Antonio Collage
Test 1: Functions and Their Graphs
Save the time creating an assessment because these function problems should do the trick. With 10 multi-part questions, they each focus on a different topic including radical, polynomial, linear and piecewise functions. The majority of...
Curated OER
Algebra I - Worksheet G12: Graphing Lines
In this graphing lines worksheet, high schoolers graph 28 lines given various data. Students graph lines given two points, a point and slope, and a line perpendicular or parallel to a point.
Curated OER
Final Exam Review: College Algebra
In this final exam review worksheet,s students solve systems of equations, polynomials and factor quadratic equations. They identify the slope of a line and write linear equations. Students use Cramer's rule, graphing,...
Curated OER
The Slope of a Line
In this slope worksheet, students examine graph and determine the slope of a line. They determine coordinates of a point to make a true statement. Students identify the dependent variable and the independent...
West Contra Costa Unified School District
Multiple Representations of Equations
class members first work through finding the equation, table of values, graph, and key features of a linear function expressed verbally. Individuals then work through several more problems given different representations.
Illustrative Mathematics
Find the Change
This exercise is an opportunity for algebra learners to understand the connection between the slope of a line and points found on the line. Use similar triangles to explain why slope m is the same between any two points. Discuss with the...
Inside Mathematics
Sorting Functions
Graph A goes with equation C, but table B. The short assessment task requires class members to match graphs with their corresponding tables, equations, and verbalized rules. Pupils then provide explanations on the process they used to...
Flipped Math
Unit 10 Review: Quadratics
Everything one wanted to know about parabolas in one place. Pupils work 27 problems as a review of the unit on quadratics. Problems range from determining key features of the function and using that information to graph the parabola, to...
Curated OER
Additional Practice Problems with Skills for Quadratic Functions and Equations
Challenge your students' graphing and factoring skills with these sets of problems for quadratic functions and equations. Here, kids plot the y-intercept and vertex of 7 parabolas. They factor and solve 9 quadratic equations. Students...
Curated OER
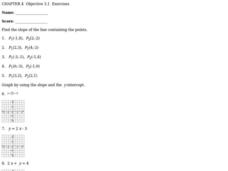
Slope of a Line
In this slope of a line worksheet, students solve ten problems determining the slope of points and an equation. First, they find the slope of the line containing the two points given in the first five problems. Then, students graph the...
Curated OER
Linear Equations
In this linear equations worksheet, 9th graders solve and complete 7 different problems that include a number of linear equations. First, they determine the slope given the points and then write an equation in slope-intercept form. Then,...
Raytheon
Equations and Graphing Review
In this equations and graphing review instructional activity, learners write, graph and solve equations for 62 problems, including a mid-unit review, with answers included.
Curated OER
Graphing Linear Equations
Students graph linear equations. In this algebra lesson plan, students perform transformation on linear equations. They identify the slope and y-intercept of each line.
Flipped Math
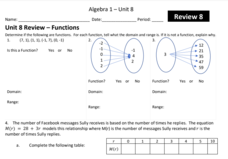
Unit 8 Review: Functions
Let's finish a functional review. Pupils work through 31 items to review the concepts learned in Unit 8. Scholars determine whether a mapping is a function and identify the domain and range. Using function notation, individuals then...
Curated OER
Basic Algebra and Computers: Spreadsheets, Charts, and Simple Line Graphs
Students, while in the computer lab, assess how to use Microsoft Excel as a "graphing calculator." They view visual representations of line graphs in a Cartesian plane while incorporating basic skills for using Excel productively.
Curated OER
Practice Problems for Linear Equations and Graphs
A worksheet that could also be used as a quiz presents students with 20 linear equations. They graph, solve for the slope, and intercepts of 8 equations. Students solve for the equation of a line, passing through given points for 6 sets...
Curated OER
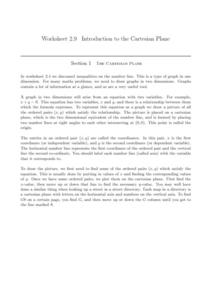
The Cartesian Plane
Learners solve and complete 22 various types of problems. First, they find the gradients of the lines and plot the given points. Then, they complete the table of values for each equation and use the table to draw the graph.
Illustrative Mathematics
Graphs of Quadratic Functions
Instead of the typical quadratic questioning, explore the function and look at the three different ways a parabola can be written. The main task is when given several clues, young mathematicians must write an equation that matches the...
Curated OER
Exercise Set 2.4: Equations of Lines
In this linear equations worksheet, students solve 36 linear equations. Students write equations of lines in slope intercept form given a graph, standard form, two points, and slope and a point.
Curated OER
Graphing Inequalities in Two Variables
This study guide is a great resource to help you present the steps to graphing linear inequalities. Show your class two different ways to graph an inequality and work on a real-world example together. The document could also be easily...


