Illustrative Mathematics
Who Has the Best Job?
Making money is important to teenagers. It is up to your apprentices to determine how much two wage earners make with their after school jobs. Participants work with a table, an equation, and a graph and compare the two workers to see...
Scholastic
Study Jams! Choosing the Correct Graph
With so many types of graphs, don't let your learners get stuck figuring out which one to use. To track how Zoe spent her allowance, use this interactive lesson to review all the types of graphs and pick the best one to display the data....
CK-12 Foundation
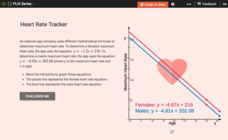
Graphs of Linear Systems: Heart Rate Tracker
Max out heart rates for males and females. Formulas of maximum heart rates provide the equations for a linear system. Pupils use the interactive to graph the equations for males and females and determine their points of intersection. The...
Curated OER
Unit 5 Lesson 01: Graphing on a Number Line
Math masters are introduced to graphing inequalities on a number line. After reviewing inequality symbols, they practice representing them on a worksheet. This simple lesson serves its purpose.
Curated OER
Points on a Line
How do you find slope? You use points on a line of course. slope. Teach your class how to calculate and differentiate between horizontal and vertical lines. They are sure to be pros at graphing lines on a coordinate plane by the end of...
Curated OER
Twenty-Seven Graphing Lines, Parabolas, and Absolute Value Problems
Have learners find coordinates of point on a graph, find equations of graphs given, and graph given equations using in and out tables. There are 27 problems related to equations for lines, parabolas, and absolute value functions.
Curated OER
Integers and the Number Line
In this integers and number line worksheet, learners solve and complete 27 different problems that include identifying integers on a number line. First, they name the coordinate of each point on a number line. Then, students graph each...
Curated OER
Points, Regions, Distance and Midpoints
In this college level coordinate geometry worksheet, students identify and graph points on a coordinate plane, find the missing side of a right triangle, determine the distance between two points, and find the midpoint of a line...
EngageNY
Drawing the Coordinate Plane and Points on the Plane
To plot a point in the coordinate plane, you first need a coordinate plane. Pupils learn to draw an appropriate set of axes with labels on a coordinate plane. They must also determine a reasonable scale to plot given coordinate pairs on...
CK-12 Foundation
Graphs for Discrete and for Continuous Data: Discrete vs. Continuous Data
Not all data is the same. Using the interactive, pupils compare data represented in two different ways. The learners develop an understanding of the difference between discrete and continuous data and the different ways to represent each...
Curated OER
Graphing Solutions To Inequalities On A Number Line
Eighth graders graph solutions to problems on a number line. After discussing algebraic expressions, 8th graders discuss how to solve them using an inequality. They observe examples and then work problems at their desks and on the...
EngageNY
Representations of a Line
Explore how to graph lines from different pieces of information. Scholars learn to graph linear functions when given an equation, given two points that satisfy the function, and when given the initial value and rate of change. They solve...
EngageNY
Graphs Can Solve Equations Too
There are many equations Algebra I learners are not ready to solve. Graphing to solve gives them a strategy to use when they are unsure of an algebraic approach to solve the problem. The lesson exposes learners to a wide variety of types...
EngageNY
Solution Sets to Equations with Two Variables
Can an equation have an infinite number of solutions? Allow your class to discover the relationship between the input and output variables in a two-variable equation. Class members explore the concept through tables and graphs and...
CK-12 Foundation
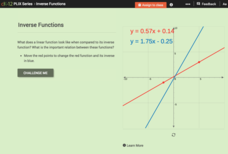
Inverse Functions
Provide a graphical view of inverses. Pupils manipulate points on a line and see the relationship of the graph with the graph of its inverse. Using the relationship between the graphs, scholars respond to questions concerning inverses...
PHET
Graphing Slope-Intercept
Slope-intercept form ... perhaps it has something to do with slope and intercepts? An easy-to-use interactive lets users adjust the locations of two points on a line. The interactive automatically updates the slope-intercept form of the...
PHET
Graphing Lines
Ready to increase pupils' understanding of slope with an upward slope? Scholars use an interactive that allows users to move two points on a coordinate plane. The interactive then automatically calculates the slope, the slope-intercept...
Curated OER
Other Equations of Lines
For this algebra worksheet, learners find equations for 4 lines when given their slope and one point on the line. They write two linear equations when given two points on a line. Students analyze the equations of 3 sets of linear...
West Contra Costa Unified School District
Graphing Systems
Get hands on with solving systems of equations graphically. A solid lesson plan uses guided practice to show how to solve systems of linear equations. It allows time for sharing ideas and provides a printable matching activity to promote...
EngageNY
Two Graphing Stories
Can you graph your story? Keep your classes interested by challenging them to graph a scenario and interpret the meaning of an intersection. Be sure they paty attention to the detail of a graph, including intercepts, slope,...
Mathed Up!
Scatter Graphs
Make an estimate by getting in line. The class works with scatter plots and lines of best fit to make an estimate for given values. Pupils determine whether there is a positive or negative correlation and draw a best-fit line. Using the...
West Contra Costa Unified School District
Point-Slope Application Problems
Create a linear equation for a problem when the intercept information is not given. The two-day lesson introduces the class to the point-slope form, which can be used for problems when the initial conditions are not provided. Pupils...
Charleston School District
The Line of Best Fit
If it's warm, they will come! Learners find a line of best fit to show a relationship between temperature and beach visitors. Previous lessons in the series showed pupils how to create and find associations in scatter plots. Now, they...
Curated OER
Plotting Coordinates on a Grid
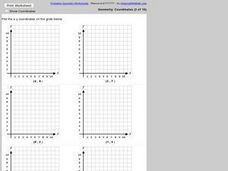
In this plotting points on a graph worksheet, students plot 6 points on 6 graphs. Students plot x and y-coordinates in the first quadrant.


