Curated OER
Study Buddies - Bar Graphs
In this data collection worksheet, students work with a partner to make 3 small bar graphs after finding the proper number of circles on the first page. They look at a page of a variety of shapes and separate the circles into black,...
Curated OER
RCX Car Line Graph
Young scholars develop a line graph based on distances that an RCX car drives in specified amounts of time. They then are given a specific amount of time for the car to drive and be asked to extrapolate the car's distance from the graph.
Curated OER
Shoe Showdown
Third graders use rulers to measure their shoe size in inches and centimeters. They then enter the class shoe measurements into an excel data base and graph the results of both to make the comparison.
Curated OER
Bugs, Bugs, Everywhere!
Students collect and compare bugs using magnifying lenses and graph data based on their comparisons. In this bugs lesson plan, students also make an aspirator by using a jar, tubing, and screen.
Curated OER
Funerals and Burial Rites
Ninth graders research burial practices that originated in West Africa and then migrated to the South Carolina and Ohio. They compare and contrast burial practices in both places. As students collect information and data, they organize...
Curated OER
Comparison of Univariate and Bivariate Data
Learners explore the concept of univariate and bivariate data. In this univaritate and bivariate data lesson, pupils discuss the differences between univariate and bivariate data. They work sample problems where they must construct box...
K20 LEARN
Comparing Numbers And Fruit—More Or Less: Comparing Numbers
A discussion begins a lesson on comparing numbers. Pupils explain how they can show a number, then visit math centers to explore number-making tools. A story read-aloud of More or Less by Stuart Murphy identifies language for comparing...
Illustrative Mathematics
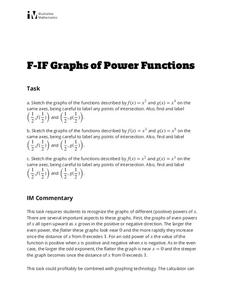
Graphs of Power Functions
This activity consists of three exercises in which learners sketch the graphs of various power functions on the same axes. They use their sketches to make comparisons and observations which lead to generalizations about the graphs of...
National Academy of Sciences
CO2 and Temperature
Scientists can model global surface temperature with and without considering human emissions, but does do these factors really make a difference? Two interactive graphs demonstrate some factors that affect climate change. The first graph...
CK-12 Foundation
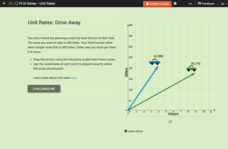
Comparison of Unit Rates: Drive Away
Five questions make up an interactive that challenges mathematicians to compare unit rates. Word problems question scholars about two friends going on a road trip. Scholars manipulate two cars on a coordinate plane to help solve word...
Curated OER
Data Analysis Challenge
In this data analysis worksheet, young scholars work with a partner to collect information for a survey. The information is then compiled into a graph. Students must indicate their survey question, the target audience, predict the...
Curated OER
Trends of Snow Cover and Temperature in Alaska
High schoolers gather historical snow cover and temperature data from the MY NASA DATA Web site. They compare this data to data gathered using ground measurements from the ALISON Web site for Shageluk Lake. They graph both sets of data...
Curated OER
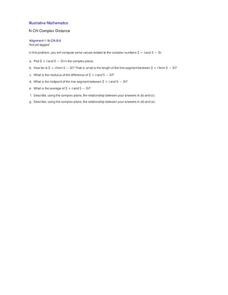
Complex Distance
Have learners graph complex numbers to gain a visual and mathematical understanding of the distance and the midpoint between two complex numbers. This lesson is short, but to the point, and addresses an important complex number concept....
University of Colorado
Marvelous Martian Mineralogy
All you need is light. Groups use a reflectometer to find the reflectivity of specific chemical compounds. Learners compare the graphs of the reflectivity of the known compounds to Martian soil. Using the graph comparisons, scholars...
EngageNY
The Power of Exponential Growth
How do you make a penny grow to $5,000 in just 15 days? Use the examples in this lesson to explore the concept of exponential growth and its comparison to linear models. Pupils come to understand that exponential growth eventually...
Curated OER
The Power of a Project
How does PBL differ from a basic thematic unit? Discover the answer to this important question. A bulleted comparison is made between each type of teaching method, example projects are included, and a full "how to" is laid out in an easy...
Curated OER
Student Costs Graph
Students calculate the mileage, gasoline costs, and travel time and costs for a vacation. They conduct a virtual field trip, and create a comparison graph of costs using Microsoft Excel software.
Curated OER
Circle Up Your M&Ms
Fifth graders estimate how many M&Ms are in a pre-counted bag. They determine how many colored M&Ms are in a bag, then decide which of the two, bar graph or circle graph (in this case, circle graph) would be best to show te results.
Curated OER
Graphic Accounts
Students identify the use of different types of bar graphs. They analyze graphs used in the New York Times to compare the estimated cost of the war in Iraq to other hypothetical expenditures and reflect on how graphs can help illustrate...
Curated OER
Step Into My Shoes
Students order their classmates from smallest to largest foot length. In this ordering their classmates from smallest to largest foot length lesson, students trace each of their classmates foot. Students read a story called, 'How Big...
Curated OER
Which Amusement Park Would You Choose?
Learners analyze data related to amusement parks and create a spreadsheet to display the data. They read the data and predict which amusement park they think is safer, create a spreadsheet and graph, and write a proposal based on their...
Curated OER
Billions of Bubbles
Students conduct an experiment with bubbles. In this observation and comparison lesson, students read Bubbles, Bubbles, Everywhere and conduct an experiment where they test different kinds of liquids to see which is the best for a...
Curated OER
When is Your Birthday?
Students use data about their birthdays to create graphs. In this collecting and communicating information instructional activity, students make a class list of their birthdays. Students use the information to make a bar graph showing...
Curated OER
Steppin' Out
Students are presented with the question: "Do longer legged people run faster than shorter legged people?" Students conduct an experiment, collect their data, create box and whisker plots using a computer and graphing program, and...


