Virginia Department of Education
Graphs
Examine different types of graphs as a means for analyzing data. Math scholars identify the type of graph from a series of data displays and then develop questions to match each one. Then, given a scatter plot of height versus age data,...
Willow Tree
Graphing
So many methods and so little time! The efficient method of graphing a linear equation depends on what information the problem gives. Pupils learn three different methods of graphing linear equations. They graph equations using...
Inside Mathematics
Graphs (2006)
When told to describe a line, do your pupils list its color, length, and which side is high or low? Use a activity that engages scholars to properly label line graphs. It then requests two applied reasoning answers.
Curated OER
Bar Graphs
Introduce scholars to bar graphs and data analysis through analyzing these visual examples. First, they look at a pictograph of fruit types and answer five observation questions. There is one done for them as an example. Learners do the...
Google
Graphing with Google Docs & Forms
Get to know your class and teach about data analysis all with the help of Google Docs. Using student-generated questions, create a class survey using Google Forms. Reserve time in the computer lab for learners to complete the form and,...
Willow Tree
Bar Graphs
Circles, lines, dots, boxes: graphs come in all shapes in sizes. Scholars learn how to make a bar graph using univariate data. They also analyze data using those bar graphs.
Inside Mathematics
Vencent's Graphs
I like algebra, but graphing is where I draw the line! Worksheet includes three multiple-part questions on interpreting and drawing line graphs. It focuses on the abstract where neither axis has numbers written in, though both are...
EngageNY
Every Line is a Graph of a Linear Equation
Challenge the class to determine the equation of a line. The 21st part in a 33-part series begins with a proof that every line is a graph of a linear equation. Pupils use that information to find the slope-intercept form of the equation...
Willow Tree
Circle Graphs
Pie isn't just for eating! Scholars learn to create pie charts and circle graphs to represent data. Given raw data, learners determine the percent of the whole for each category and then figure out the degree of the circle that percent...
CK-12 Foundation
Single Bar Graphs: Hockey Teams
Raise the bar for hockey fans. Using data about favorite hockey teams, pupils build a bar graph. They use the information from the graph to make comparisons and solve one- and two-step problems.
CK-12 Foundation
Multiple Line Graphs: Jack's Jumpshot
What are the advantages to seeing multiple data sets on the same graph? Scholars explore this question as they manipulate the animation within the lesson. Questions within the interactive ask individuals to make comparisons across the...
Inside Mathematics
Graphs (2007)
Challenge the class to utilize their knowledge of linear and quadratic functions to determine the intersection of the parent quadratic graph and linear proportional graphs. Using the pattern for the solutions, individuals develop a...
Inside Mathematics
Graphs (2004)
Show your pupils that perimeter is linear and area is quadratic in nature with a short assessment task that requests learners to connect the graph and equation to a description about perimeter or area. Scholars then provide a...
Curated OER
Interpreting Graphs
Sixth graders interpret linear and nonlinear graphs. They create graphs based on a problem set. Next, they represent quantitive relationships on a graph and write a story related to graphing.
Willow Tree
Line Graphs
Some data just doesn't follow a straight path. Learners use line graphs to represent data that changes over time. They use the graphs to analyze the data and make conclusions.
Curated OER
Bar Graphs
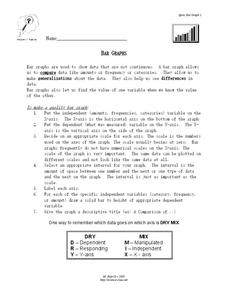
In this bar graph worksheet, students read about making quality bar graphs and they make a bar graph using given data. They answer 5 questions about their graph.
Teach Engineering
Cost Comparisons
Our final proposal for the cost of the bridge requested is ... In the last segment in a series of 10, pairs work together to develop a proposal for a city bridge design. The class completes a cost comparison between concrete and steel to...
NOAA
Graphing Temperatures
Battle of the hemispheres? In the fourth installment of a five-part series, young oceanographers use the NOAA website to collect temperature data from drifters (buoys), one in the Northern Hemisphere and one in the Southern Hemisphere....
CK-12 Foundation
Interpretation of Circle Graphs: Northwest Region Population Pie
Given populations of the five Northwestern states, learners create a circle graph. Using the data and the pie chart, they make comparisons between the populations of the states. Finally, the pupils determine how the chart will change...
Curated OER
Call of The Wild
Prompt your class to interact with Jack London's Call of the Wild. By analyzing the events in the novel, middle schoolers discover how human experiences create who a person becomes. They critique and analyze the reading, focusing on...
Curated OER
Applied Science - Science and Math Lab
Students make a prediction. In this applied science lesson, students guess the number of items in a jar. Students create a bar graph to show the predictions and the actual amounts.
Project Maths
Trigonometric Functions
From a circle to a cycle! The final lesson plan of a five-part series challenges learners to use points from the unit circle to plot a repeating pattern. The repeating patterns become the graphs of the trigonometric functions. Scholars...
University of Colorado
Spacecraft Speed
Space shuttles traveled around Earth at a speed of 17,500 miles per hour, way faster than trains, planes, or automobiles travel! In the 13th installment of 22, groups graph different speeds to show how quickly spacecraft move through...
EngageNY
Solution Sets to Inequalities with Two Variables
What better way to learn graphing inequalities than through discovering your own method! Class members use a discovery approach to finding solutions to inequalities by following steps that lead them through the process and even include...


