West Contra Costa Unified School District
Comparing Rational Functions and Simplified Functions
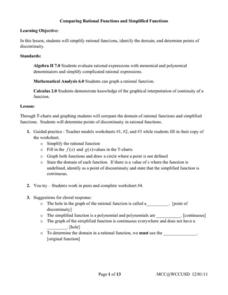
What kind of functions have holes in their graphs? Here, the teacher guides the class on how to use the simplified function of a rational function to aid in the graphing of the original rational function. T-tables are used in order to...
Curated OER
Using Graphs and Charts
Students complete T charts and manipulate numbers using graphs and charts. For this math graphs and charts lesson, students review the concepts of pattern and function. Students then complete practice pages where they manipulate numbers...
Curated OER
T-Charts
In this literacy worksheet, students use the t-charts that are designed for the specific activity. The sheet is a teacher's guide to making them.
Curated OER
VARIABLES AND PATTERNS, USE AFTER INVESTIGATION THREE. DISCRETE OR CONTINUOUS LINEAR RELATIONS.
Learners discover for which kind of linear function is appropriate to use the "scatter" or the "connected" term. In this lesson, students investigate functions using variables, patterns book, graph paper, rulers and the graphit program.
Curated OER
What's My Function?
Students use input / output tables to help them solve algebraic equations. They use patterns and relations to represent and analyze mathematical situations using algebraic symbols.
Curated OER
Healthy Heart
Learners examine the functions of the heart and ways to maintain a healthy heart. In this human body science lesson plan, students listen to Magic School Bus Inside the Human Heart, and diagram the human heart and blood flow. Learners...
Curated OER
Student Designed Investigations Part 4 - Poster Presentations/Science Fair
Third through fifth graders prepare posters to present at a science fair. Working with a partner, pupils conduct investigations and prepare a poster to present their findings. They rehearse their presentations, and add visual aids;...
Curated OER
Would You Like to Attend School in Japan?
Sixth graders construct pro and con T-charts about their education system and that of Japan. They choose which system they prefer and give five reasons for it. Their reasons must be based on strong arguments and evidence.
Curated OER
Recycling Statistics
In this environment worksheet, students look for the answers to the environmental impact of recycling in Great Britain with the statistics from the pie graph.
Curated OER
What's My Pattern?
Students recognize, describe and extend patterns in three activities. They organize data, find patterns and describe the rule for the pattern as well as use the graphing calculator to graph the data to make and test predictions. In the...
Curated OER
Frequency, Histograms, Bar Graphs and Tables
In this frequency worksheet, students interpret histograms, bar graphs and tables. They examine frequency charts and comparison line graphs. This three-page worksheet contains 4 problems. Answers are provided on the last page.
Curated OER
Immune System Alive
Students examine the function of the immune system. They read and discuss text, complete a K-W-L chart, sequence photos of white blood cells encountering bacteria, develop an outline, and write an essay.
Curated OER
Lesson 3: What Happens When a Bank Makes a Loan?
Students role-play to show how bank loans made to people can have an impact on others in the community. In small groups, they analyze hypothetical loans, using flow charts or other diagrams to describe the probable impact of each.
Curated OER
Graphing Regions: Lesson 2
Students identify and analyze geographical locations of inventors. They each identify where their inventor is from on a U.S. map, discuss geographic patterns, and create a t-chart and graph using the Graph Club 2.0 Software.
Curated OER
Data Analysis
Pupils double check their data collections of Top 20 singles that they've been collecting for several days. Types of data is reviewed in detail and a variety of questions are asked for retention factors of mastery. They draw a tally...
Curated OER
Data Collection and Presentation
Students concentrate on discrete quantiative data. They are shown that the vertical line diagram as a more appropriate way to present discrete quantiative data then bar charts. Students work as a group to help with the interpretation...
Curated OER
Esperanza Rising - Anticipation Guide
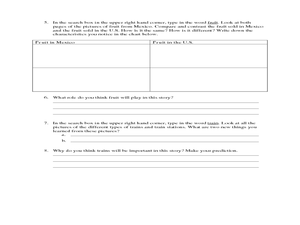
Learn about Mexican culture while simultaneously strengthening reading, writing and computer skills. In order to get the most out of Esperanza Rising, pupils should have prior knowledge of Mexican culture. Therefore, there are links to a...
Curated OER
You Can't Go Wrong with a Right Triangle 2
Upper graders use the properties of right angle trignonmetry to measure objects such as the school flagpole. They solve real world problems using these properties.
Curated OER
Burger King Investigation
Students study data on the nutritional value of Burger King meals in order to discover its nutritional value and also to compare the meals, using mathematical computation, to the recommended daily diet. In this data handling lesson,...
Curated OER
Questionnaires and Analysis
Students, review the techniques and different types of data analysis as well as how they are expressed, identify why facts and data are needed in conclusion of a questionnaire. The concepts of qualitative and quantitative data are...
Curated OER
Three Branches of Government
Fourth graders brainstorm of what they think of when they think about the word state government and list their suggestions on the board. They listen to lecture about the three branches of government understanding how each branch is...
Curated OER
Fish Haunts
Students examine some of the different ecosystems that fish live in. While doing this they identify the species of fish and the ecological conditions needed for survival. Students use research resources to make fish cards that have...
Curated OER
For The Birds
Seventh graders list the features of an ecosystem and identify local bird species. In this bird lesson plan students work in groups to formulate a hypothesis and test their theory by collecting and analyzing data.
Curated OER
Habitats: Rainforest
Students use the internet to find reasons the rainforest is endangered and ways that affects the rest of the world. They read for information, perform experiments, locate rainforests on maps, and write about this ecosystem.


