Shodor Education Foundation
Graph Sketcher
Sketch graphs with the Graph Sketcher. Scholars graph functions on a coordinate plane. An interactive makes it as easy as inputting the function and clicking a button.
EngageNY
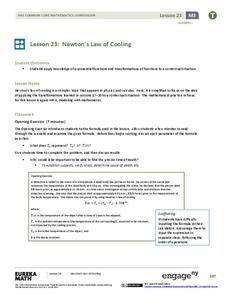
Newton’s Law of Cooling
As part of an investigation of transformations of exponential functions, class members use Newton's Law of Cooling as an exponential model to determine temperature based on varying aspects. The resource makes comparisons between...
Shodor Education Foundation
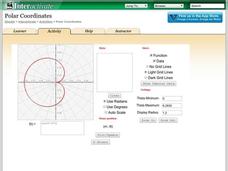
Polar Coordinates
Polar opposites might not work together—but polar coordinates do! The interactive provides learners the opportunity to graph trigonometric and algebraic functions using polar coordinates. The program takes either individual data points...
Flipped Math
Calculus AB/BC - Interpreting the Behavior of Accumulation Functions Involving Area
Accumulation functions should behave like other functions. Using content from Unit 5, pupils analyze the first and second derivative to determine the behavior of an accumulation function. Learners find out how to calculate the relative...
CK-12 Foundation
Finding and Defining Parts of a Polynomial Function Graph
So many things to remember when graphing polynomials and this guide gives a helping hand to do so. The packet goes through examples and explains things like critical values, end behavior, and multiplicities. There are image links and...
Illustrative Mathematics
Hours of Daylight 1
The midline of the mathematical model of the number of hours of sunlight is not 12 hours. Pupils use the modeling cycle to determine a function that will model the number of hours of sunlight at a location of their choosing. Using...
CCSS Math Activities
Ferris Wheel
Wheel the resource right into your classroom. Young mathematicians use given dimensions of a Ferris wheel to write a height versus time function. They use their functions to answer a set of questions about the Ferris wheel.
Mathematics Vision Project
Module 7: Structure of Expressions
The structure of an expression is a descriptive feature. Learners build a solid understanding of quadratic functions using an analysis of expressions in different forms. The seventh module in a series of nine includes 12 lessons...
National Council of Teachers of Mathematics
National Debt and Wars
Take a functional approach to the national debt. Learners collect information about the national debt by decade and plot the data. They determine whether an exponential curve is a good fit for the data by comparing the percent changes...
EngageNY
Trigonometry and Complex Numbers
Complex numbers were first represented on the complex plane, now they are being represented using sine and cosine. Introduce the class to the polar form of a complex number with the 13th part of a 32-part series that defines the...
Balanced Assessment
Vacation in Bramilia
This performance task gives the population model of different types of flies and asks scholars to analyze the two populations. After interpreting the functions individually, participants compare the two populations and find the time...
02 x 02 Worksheets
Inverse Variation
Discover an inverse variation pattern. A simple lesson plan design allows learners to explore a nonlinear pattern. Scholars analyze a distance, speed, and time relationship through tables and graphs. Eventually, they write an equation to...
SHS Algebra
Linear vs. Exponential Functions Tasks
Your algebra learners will enjoy the real-life application of the three tasks presented here. They complete a table and a graph comparing the two options presented. One option is linear, while the other is exponential. After coming up...
Flipped Math
Calculus AB/BC - Approximating a Function's Value Using Local Linearity
No need to be exact every time. Pupils watch an engaging video on approximating function values. They see how to write the equation of a tangent line, use it to calculate approximations, and then determine whether it is an overestimate...
Curated OER
Graphing Quadratic Functions in Vertex or Intercept Form
Here is a study guide that breaks graphing quadratic functions into three simple steps. Quadratic functions in vertex and intercept form are included. Use during a lesson or afterward for skills practice. Note: Make sure your class has...
Chapman University
Graphs of the Sine and Cosine Function in Degrees
This bright, clear, graphic, display of the sin(x) and cos(x) functions spans the domain between -360 degrees and 360 degree. Use it as a poster, handout, presentation slide, or project it onto a whiteboard.
Chapman University
Graphs of the Sine and Cosine Function in Radians
This bright, clear, graphical display of the sin(x) and cos(x) functions spans the domain between -2 pi radians and 2 pi radians. Use it as a poster, handout, presentation slide, or project it onto a...
Curated OER
Dialogue Practice with the Continuous Tenses
Students work with a partner to write dialogues using the present continuous, past continuous, future continuous and present perfect continuous tenses about an real situation. They perform the dialogues in front of the class.
Curated OER
More Complicated Functions: Introduction to Linear Functions
Young scholars explore the concept of linear functions. In this linear functions lesson plan, students translate linear functions from tables to graphs to equations. Young scholars use an applet to write a function rule for a linear...
Curated OER
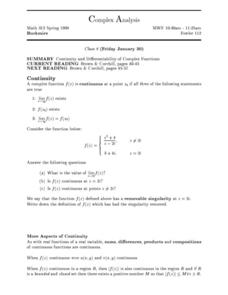
Complex Analysis: Complex Function
In this complex function worksheet students identify the derivative of given functions and explore the rules of differentiation. This two-page worksheet contains explanations and examples, followed by ten problems.
Curated OER
Introduction to Linear Functions
Students are introduced to the basic ideas needed for understanding linear functions.
Curated OER
Functions
Students explore a variety of functions. They recognize and describe functions and use linear functions to describe situations. Students find the domain and range of linear functions and graph rational expressions.
Curated OER
Functions and the Vertical Line Test
Students explore the concept of functions. In this function lesson, students determine if the graph is a function by using the vertical line test. Students use an applet to explore the vertical line test on a variety of graphs.
Curated OER
Composition of Functions
Students solve composition of functions. In this algebra lesson, students find the sum, difference and product of functions. They find the inverse of a function.
Other popular searches
- Math Functions
- Quadratic Functions
- Exponential Functions
- Linear Functions
- Rational Functions
- Parent Functions
- Trigonometric Functions
- Inverse Functions
- Eye Functions
- Composite Functions
- Cell Organelles Functions
- Trigonometry Functions

