Curated OER
Linear Functions: Slope, Graphs, and Models
This math packet provides an opportunity for learners to graph two linear equations on a coordinate grid and determine the slope and y-intercept of each. They use the equation of five lines to find the slope and y-intercepts, and then...
Curated OER
Finding the Limit: Piecewise Functions and Graphs
This pre-calculus worksheet is short, yet challenging. High schoolers calculate the limit of piecewise functions, rational functions, and graphs as x approaches a number from the positive or negative side. There are four questions.
Curated OER
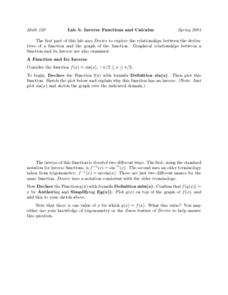
Lab 5: Inverse Functions and Calculus
Learners identify graphical relationships between a function and its inverse using a graphing calculator. They begin by declaring the function f(x) with formula definition sin(x), then plot this function. To finishing the lab, they check...
Curated OER
Chapter 4 Test: Functions and Integers
In this functions and integers worksheet, learners combine positive and negative integers through addition, subtraction, multiplication and division. They complete function tables and graph the results of linear equations. This six-page...
EngageNY
Increasing and Decreasing Functions 2
Explore linear and nonlinear models to help your class build their function skills. In a continuation of the previous lesson, learners continue to analyze and sketch functions that model real-world situations. They progress from linear...
EngageNY
Increasing and Decreasing Functions 1
Model situations with graphs. In the fourth installment of a 16-part module, scholars learn to qualitatively analyze graphs of piecewise linear functions in context. They learn to sketch graphs for different situations.
Mathematics Vision Project
Linear and Exponential Functions
Provide a continuous progression to linear and exponential functions. Pupils continue to work with the discrete functions known as sequences to the broader linear and exponential functions. The second unit in a series of nine provides...
Charleston School District
Intro to Functions
How are functions related to chicken nuggets? A video teaches the concept of a function using the idea of a nugget-making machine as an analogy for a function machine. Learners determine if a relation is a function from an equation and a...
Charleston School District
Review Unit 3: Functions
Time to show what you know about functions! The review concludes a series of nine lessons on the basics of functions. The problems included are modeled from the previous lessons. Pupils determine if a table represents a function,...
EngageNY
Graphs of Linear Functions and Rate of Change
Discover an important property of linear functions. Learners use the slope formula to calculate the rates of change of linear functions. They find that linear functions have constant rates of change and use this property to determine if...
Mathematics Assessment Project
Representing Trigonometric Functions
Discover the classic example of periodicity: Ferris wheels. Young mathematicians learn about trigonometric functions through Ferris wheels. They match functions to their graphs and relate the functions to the context.
Mathematics Vision Project
Module 7: Trigonometric Functions, Equations, and Identities
Show your class that trigonometric functions have characteristics of their own. A resource explores the features of trigonometric functions. Learners then connect those concepts to inverse trigonometric functions and trigonometric...
Shodor Education Foundation
Function Flyer
Fly through graphing functions with the Function Flyer. Young mathematicians use an interactive to graph different types of functions. A set of exploration questions has users investigate patterns in functions.
Charleston School District
Graphing Functions
How do letters and numbers create a picture? Scholars learn to create input/output tables to graph functions. They graph both linear and nonlinear functions by creating tables and plotting points.
Shodor Education Foundation
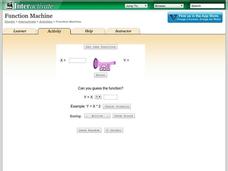
Function Machine
Machines can be so helpful sometimes. A simple interactive has learners enter input values for a function machine and observe output values. These values help determine a function that represents the input-output relationship in the...
EngageNY
Comparing Linear Functions and Graphs
How can you compare linear functions? The seventh installment of a 12-part module teaches learners how to compare linear functions whose representations are given in different ways. They use real-world functions and interpret features in...
Charleston School District
Graphs of Linear Functions
What does a slope of 2/3 mean? Develop an understanding of the key features of a linear function. Pupils graph the linear functions and explain the meaning of the slope and intercepts of the graphs.
EngageNY
The Concept of a Function
Explore functions with non-constant rates of change. The first installment of a 12-part module teaches young mathematicians about the concept of a function. They investigate instances where functions do not have a constant rate of change.
Charleston School District
Contextualizing Function Qualities
Let the graph tell the story! Adding context to graphs allows learners to analyze the key features of the function. They make conclusions about the situation based on the areas the graph is increasing, decreasing, or has a maximum or...
Charleston School District
Sketching a Piecewise Function
How do you combine linear and nonlinear functions? You piece them together! The lesson begins by analyzing given linear piecewise functions and then introduces nonlinear parts. Then the process is reversed to create graphs from given...
EngageNY
Examples of Functions from Geometry
Connect functions to geometry. In the ninth installment of a 12-part module, young mathematicians create functions by investigating situations in geometry. They look at both area and volume of figures to complete a well-rounded lesson.
Mathematics Vision Project
Quadratic Functions
Inquiry-based learning and investigations form the basis of a deep understanding of quadratic functions in a very thorough unit plan. Learners develop recursive and closed methods for representing real-life situations, then apply these...
Charleston School District
Equations of Linear Functions
Teaching linear function relationships using contextual information is beneficial to pupils' understanding. The lesson uses problem solving to build linear functions given different information for each problem. This is the second in a...
CK-12 Foundation
Graphs for Discrete and for Continuous Data: Discrete vs. Continuous Data
Not all data is the same. Using the interactive, pupils compare data represented in two different ways. The learners develop an understanding of the difference between discrete and continuous data and the different ways to represent each...
Other popular searches
- Math Functions
- Quadratic Functions
- Exponential Functions
- Linear Functions
- Rational Functions
- Parent Functions
- Trigonometric Functions
- Inverse Functions
- Eye Functions
- Composite Functions
- Cell Organelles Functions
- Trigonometry Functions


