Curated OER
Probability Two Events
Middle schoolers investigating the concept of probability practice the concept using a variety of different example problems. The lesson is delivered in a question and answer format. The frequency of answers is recorded in a data table...
Curated OER
Paper Parachutes
Students participate in a simulation of a parachute-jump competition by making paper parachutes and then dropping them towards a target on the floor. They measure the distance from the point where the paper parachute lands compared to...
Curated OER
Fair Play- Probability Worksheet
In this fair play probability worksheet, 4th graders use the given spinner to determine how many times a student will land on a vowel if they spin 18 times. They toss number cubes 20 times and complete a tally chart that shows the number...
Curated OER
Pictograms
Have your class practice using a pictogram with this resource. Learners count tally marks, and answer a few questions related to the graph. Afterwards, they could create their own pictograms.
Curated OER
Working with Wavelets
In this working with wavelets worksheet, students solve 7 various problems that include working with different wavelets in each. They compute the synthesis given two segments and y, describing what they observe. Then, students plot...
Curated OER
Probability at Play
For this probability worksheet, students read data regarding a ring toss game and respond to 4 short answer questions pertaining to probability.
Curated OER
Mathematics of Image Processing Project
In this image processing worksheet, students complete 4 steps related to image processing. First, they work in teams of 2-3 and create a hard copy report and documented m-files. Then, students try compression at various quality levels...
Curated OER
Ice Cream Scoop
In this data display learning exercise, students write 6 flavors of ice cream on pieces of paper. Students choose papers one at a time and keep track on a tally sheet. Students make a bar graph of the results.
Curated OER
Questionnaires and Analysis
Students, review the techniques and different types of data analysis as well as how they are expressed, identify why facts and data are needed in conclusion of a questionnaire. The concepts of qualitative and quantitative data are...
Curated OER
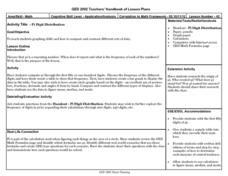
Pi Digit Distribution
Students study graphing skills and compare and contrast data sets. They compute pi through the first 50-100 digits and create a bar graph showing the frequencies of specific digits.
Curated OER
What's Your Favorite Stuffed Animal?
Second graders gather information in a survey and interpret the results using a tally chart, a table, and a bar graph. They' present their results of the during the final group discussion. The subject of the survey is favorite stuffed...
Curated OER
Measuring the Speed of a Wave
Learners create an experiment in which they measure the speed of a wave and record the data in a graph. They work in small groups to write the procedure for the experiment and share it with another group for cross checking of the...
Statistics Education Web
The Case of the Careless Zookeeper
Herbivores and carnivores just don't get along. Using a box of animal crackers, classes collect data about the injury status of herbivores and carnivores in the box. They complete the process of chi-square testing on the data from...
Utah Education Network (UEN)
The Human Line Plot
Learners collect data and use charts and line plots to graph the data. Some excellent worksheets and activities are embedded in this fine lesson on line plots.
Curated OER
Data Analysis Challenge
In this data analysis worksheet, young scholars work with a partner to collect information for a survey. The information is then compiled into a graph. Students must indicate their survey question, the target audience, predict the...
Mathed Up!
Stratified Sampling
Young mathematicians learn how to solve problems involving stratified sampling. They review concepts of sampling and proportionality by watching a video and then they complete a worksheet of questions on this topic.
Mathematics Assessment Project
Sampling and Estimating: Counting Trees
Your task today: count all the trees on a tree farm. To complete the assignment, learners first estimate the number of trees on a tree farm using random sampling. To improve their own response they then evaluate provided responses to the...
Curated OER
Analyzing Discrete and Continuous Data in a Spreadsheet
You are what you eat! Your statisticians keep a log of what they eat from anywhere between a day to more than a week, keeping track of a variety of nutritional information using a spreadsheet. After analyzing their own data, individuals...
Curated OER
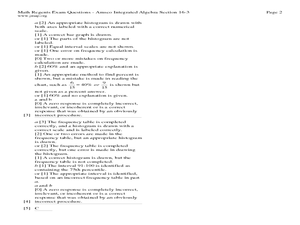
The Histogram
In this Algebra I/Algebra II worksheet, students construct and analyze histograms to develop a visual impression of the distributions of data. The two page worksheet contains five problems. Answer key is provided.
Raytheon
Data Analysis and Interpretation
For this data analysis and interpretation worksheet, learners use charts, graphs, statistics to solve 42 pages of problems with answer key included.
Curated OER
Count The Letters
Students perform activities involving ratios, proportions and percents. Given a newspaper article, groups of students count the number of letters in a given area. They use calculators and data collected to construct a pie chart and bar...
Curated OER
Data Analysis and Probability
Students make their own puzzle grid that illustrates the number of sit-ups students in a gym class did in one minute, then they make a histogram for this same data. Then they title their graph and label the scales and axes and graph the...
Curated OER
Organizing Data
In this organizing data worksheet, 7th graders solve seven different types of problems related to data. They first identify the type of data as categorical, discrete or continuous from the information given. Then, students use Excel to...
Alabama Learning Exchange
Pennies, Pennies and More Pennies
Learners determine the number of pennies needed to fill a room. In this pennies lesson plan, students work in groups to determine the number of pennies needed to fill a room. They compute the probability of the head of a pin landing on...
Other popular searches
- Frequency Tables Line Plots
- Math Frequency Tables
- Making Frequency Tables
- Reading Frequency Tables
- Creating Frequency Tables
- Cumulative Frequency Tables
- Frequency Tables 7th Grade
- Intro to Frequency Tables
- Making Frequency Tables Quiz


