EngageNY
Presenting a Summary of a Statistical Project
Based upon the statistics, this is what it means. The last lesson in a series of 22 has pupils present the findings from their statistical projects. The scholars discuss the four-step process used to complete the project of their...
BW Walch
Solving Exponential Equations
Introducing exponential equations means learners need to take all the rules and tricks they learned for exponents and actually apply them. This presentation comes to the rescue by touching on changing bases in exponential...
Curated OER
Statistical Pictures of School and Life
Students explore how mathematical data is used to summarize and illustrate everyday life. They apply mathematical concepts and skills to analyze data. Students conduct a five question survey of 50 people or more and graph the data.
Inside Mathematics
Snakes
Get a line on the snakes. The assessment task requires the class to determine the species of unknown snakes based upon collected data. Individuals analyze two scatter plots and determine the most likely species for five...
EngageNY
Relationships Between Two Numerical Variables
Is there another way to view whether the data is linear or not? Class members work alone and in pairs to create scatter plots in order to determine whether there is a linear pattern or not. The exit ticket provides a quick way to...
Curated OER
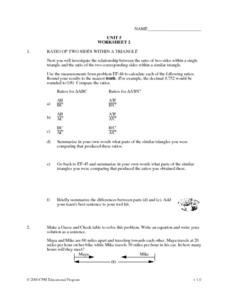
Unit 5: Worksheet 2 - Ratios
In this ratio worksheet, students investigate the relationship between the ratio of two sides of similar triangles. Afterwards, they convert fractions, decimals, and percents. This three-page worksheet contains approximately 35...
Curated OER
Data Collection Project
Students collect data using email. They calculate the mean, median, mode, range and outliers. They create a graph using the data results. They write five paragraphs to summarize their data.
Curated OER
Geo Jammin' By DeSign - Day 7, Lesson 37: Summarizing for the Summative
Students listen for specific information during summary presentations. They practice giving feedback on given topic according to a set of standards. The speaker reports to the rest of class from a report and listeners determine if...
EngageNY
Points of Concurrencies
You say that perpendicular bisectors intersect at a point? I concur! Learners investigate points of concurrencies, specifically, circumcenters and incenters, by constructing perpendicular and angle bisectors of various triangles.
Curated OER
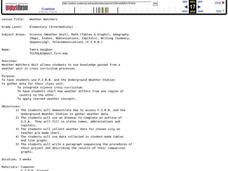
Weather Watchers
Students are introduced to an Underground Weather Stations. In groups, they use the internet to research the weather in different parts of the United States locating each city. To end the lesson, they summarize the information they...
Curated OER
Disc/Washer Method
Young scholars calculate the volume of solids. In this calculus lesson, students apply the Disk and Washer Method to solve for the volume of three dimensional objects. They calculate the volume caused by rotation that...
Curated OER
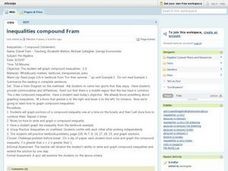
Inequalities Compound Fram
Students practice graphing compound inequalities. They draw a Venn Diagram on two different sports visualizing that their is a middle section on commonality among the two sports groups and then relate that concept to compound inequalities.
Texas Instruments
Measure Up!
Statisticians take things to new heights using a set of height measurements. Students use TI-82 or TI-83 calculators to determine extreme values and the median for the data. They also construct a box-and-whisker plot to summarize the...
Curated OER
Adding & Subtracting (Combining) Integers
Maintain a positive atmosphere in your math class with this fun lesson on adding and subtracting integers. After first explaining the rules for combining positive and negative numbers, this resource uses a comic strip...
EngageNY
Sampling Variability in the Sample Proportion (part 2)
Increase your sample and increase your accuracy! Scholars complete an activity that compares sample size to variability in results. Learners realize that the greater the sample size, the smaller the range in the distribution of sample...
Curated OER
Compass Designs
Learners investigate the properties of two and three dimensional objects. In this geometry lesson, students differentiate polygons based on similarity and congruence. They make observation and interpret the data.
Curated OER
Native American Foods
Young scholars explore Native American foods. In this middle school mathematics lesson, students research the types of foods Native Americans across the country typically ate. Young scholars summarize a recipe in their own...
Curated OER
Adding and Subtracting Fractions
Second graders use blocks to show the addition and subtraction of fractions with common denominators. They identify the steps in these functions and complete a worksheet.
Curated OER
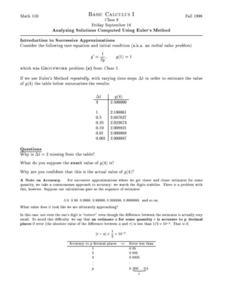
Analyzing Solutions Computed Using Euler's Method
In this analyzing solutions worksheet, students use Euler's Method to estimate the value of given functions. They estimate solutions using the piecewise-linear function model and sketch the information onto a graph. This two-page...
Mathematics Vision Project
Module 3: Polynomial Functions
An informative module highlights eight polynomial concepts. Learners work with polynomial functions, expressions, and equations through graphing, simplifying, and solving.
Curated OER
Changes in Latitudes, Changes in Attitudes
Sixth graders discuss how people, society, and technology change over time through a unit of integrated lessons. In these changes in society lessons, 6th graders discuss the answers to many questions about how changes effect the...
Curated OER
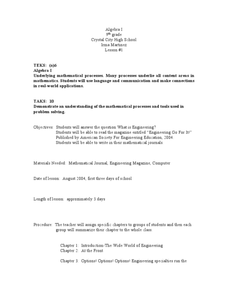
Problem Solving Using Math
Students solve real life scenarios using algebra. For this word problem lesson, students use different websites dealing with engineering as it relates to the real world and math. They use other resources such as magazines to solve word...
Curated OER
Y-Intercept and Slope Intercept Form
Alegebra amateurs identify the slope and the y-intercept given a linear equation in slope-intercept form by correctly completing some in class problems. They write the linear equation in slope-intercept form that corresponds to the given...
Inside Mathematics
Population
Population density, it is not all that it is plotted to be. Pupils analyze a scatter plot of population versus area for some of the states in the US. The class members respond to eight questions about the graph, specific points and...


