Curated OER
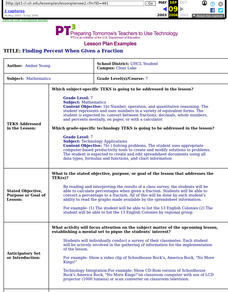
Finding Percent When Given A Fraction
Seventh graders calculate percentages when given a fraction. They convert a percentage to a fraction. All of this be done by each student's ability to read the graphs made available by the spreadsheet information.
Curated OER
Aldridge Sawmill -- The Story in Numbers
Seventh graders view a recent transparency of the average rainfall zones of the state of Texas. Using another transparency, they identify the Piney Woods subregion of the Gulf Coastal Plain and locate national forests and sawmills. ...
Curated OER
Aboriginal Statistics
Fourth graders analyze statistics of Native Americans by creating graphs. In this data analysis lesson plan, 4th graders define different statistical terms and practice finding those statistics from groups of numerical information...
Curated OER
Cartoons for the Classroom: 2012 Mid-Term Elections
Use a political cartoon to help scholars grasp the significant turnover in Congress following the 2012 mid-term election. A Mike Keefe cartoon uses symbols and current political lingo to convey perspective on the issue, and background...
Global Oneness Project
Freedom to Change
Here's something unusual and thoughtful: have your scholars do some pensive reflection themselves before tackling how such meditative techniques are used in prison rehabilitation programs. They watch the...
Curated OER
Majority Rules
Students practice the voting process by taking a group vote using fractions or percents. In this voting process lesson plan, students review the voting process and vote using hands or a private ballot. Students tally the responses to the...
Northeastern Educational Television of Ohio, Inc.
Roman World vs. Feudal World
Young historians compare the major features of the Roman and feudal worlds, such as religion, social hierarchy, and political tenets, using online resources and group discussion.
Curated OER
Aldridge Sawmill - The Story in Numbers
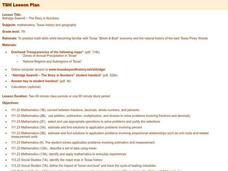
Seventh graders view overhead maps of Texas, explore history of Aldrige Sawmill, and practice math skills while becoming familiar with Texas' "Boom & Bust" economy and natural history of east Texas Piney Woods.
Curated OER
Aldridge Sawmill - The Story in Numbers
Seventh graders practice math skills while becoming familiar with Texas' "Boom & Bust" economy and the natural history of the east Texas Piney Woods. They utilize worksheets and websites imbedded in this plan.
Curated OER
Maps
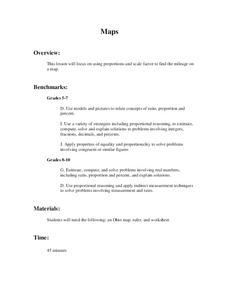
Students figure out the mileage from one state to another using a map. In this map lesson, students look at the scale factor and turn it into a fraction. They measure the distance between two cities and use the proportion to find the...
Curated OER
Population Ratios
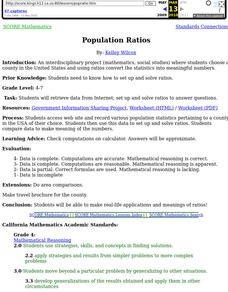
Students access web site and record various population statistics pertaining to a county in the USA of their choice. They use this data to set up and solve ratios. They compare data to make meaning of the numbers.
Curated OER
Texas History Math
Seventh graders practice math skills while they become familiar with Texas' Boom & Bust economy and the natural history of the east Texas Piney Woods.
Curated OER
Breaking News English: World Toilets
In this world toilets worksheet, students read the article, answer true and false questions, complete synonym matching, complete phrase matching, complete a gap fill, answer short answer questions, answer discussion questions, write, and...
Curated OER
The Pony Express
Students plot the route of the Pony Express. They discover the kinds of terrain it crossed. They calculate the number of legs needed to cover the distance of its total route.
Curated OER
A Statistical Look at Jewish History
Students complete their examination over the Jewish Diaspora. Using population figures, they discover the importance of percentages in exploring trends. They use their own ethnic group and determine how it is represented in the United...
Curated OER
Dubious Adoption Data
Students analyze a graph from the New York City Administration for Children's Services that shows a significant increase in New York City adoptions after ACS was founded. They determine whether the graph supports ACS' claims and whether...
Curated OER
Meatiest States: Graph Problem Solving
In this graph problem solving worksheet, learners analyze a graph that shows commercial red meat production in five states. Students answer 5 word problems using the data on the graph.
