Curated OER
Parallel and Perpendicular Lines
Young geometers get some solid skills practice in evaluating slopes. Beginning with the basics of slope through two points and progressing through properties of parallel and perpendicular lines, the building of skills is gradual and...
Curated OER
Lesson Plan On Fran Data
Seventh graders investigate the concept of functions and how they are used in the context of the real world while identifying the dependent and independent variables. They graph relations and functions and find the zeros of functions....
Curated OER
Worksheet 7, Polynomials
In this algebra worksheet, learners graph 3 polynomial functions. They find the intercepts, and the intervals above the x axis. Students create their own polynomials with given characteristics.
Curated OER
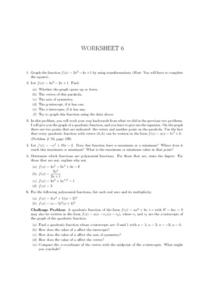
Worksheet 6, Graphing Functions
In this algebra worksheet students graph a given function by completing the square. They analyze a function and tell the axis of symmetry, the intercepts, and vertex. Students identify the maximum or minimum of a graph. Students identify...
Curated OER
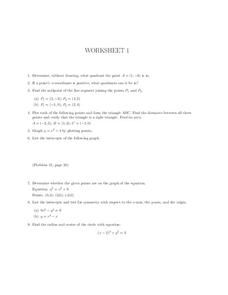
Worksheet 1, Coordinate Graphing
In this algebra worksheet, students determine the quadrant a given point is in. They find the midpoints of two line segments. Students plot points to form a triangle and find the distance between points. Students find the area of the...
Curated OER
Write an Equation of a Line Given Slope and a Point
Ninth graders are investigating slope of a line. The line is plotted using the slope and points on a line. They also write an equation given the right information. The use of a PowerPoint is part of the presentation.
West Contra Costa Unified School District
Standard Form of Conics
Looking for a complete go-to guide for the standard form of conics? This five-page packet does a nice job of connecting conics to prior knowledge of functions and transformations. Adapt the resource as Algebra II lesson plan...
Curated OER
Mystery Liquids: Linear Function
High schoolers determine the linear equations of the density of water and oil by collecting data on the mass of various volumes of each liquid. They construct scatter plots from the data and use these to write the linear equations for...
West Contra Costa Unified School District
Discovering Slope of a Line in Standard Form
From start to finish this skills practice resource provides a way for individuals to explore the standard form equation of a line. Begin with a warm-up, work through the problems, and then discover the relationship between the...
University of Texas
A Library of Parent Functions
Don't think this lesson is for Mom and Dad; parent functions are all for your high schoolers. Flip through a presentation with a focus slide on each type of graph and its characteristics. Some examples are included but the...
West Contra Costa Unified School District
Graphing Systems
Get hands on with solving systems of equations graphically. A solid lesson plan uses guided practice to show how to solve systems of linear equations. It allows time for sharing ideas and provides a printable matching activity...
Curated OER
How Long Can You Go?
Eighth graders examine the usefulness of a line of best fit by collecting and graphing data, using a graphing calculator to determine the line of best fit, and making a variety of predictions. They watch a video, then design a...
5280 Math
More or Less the Same
Tell the story of the math. Given a graph of a linear system, learners write a story that models the graph before crafting the corresponding functions. Graphs intersect at an estimated point, allowing for different variations in the...
Houston Area Calculus Teachers
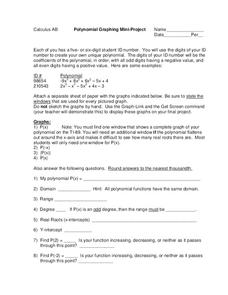
Polynomial Graphing
Your AP Calculus learners probably have their ID numbers memorized, but have they tried graphing them? Pique your pupils' interest by asking each to create a unique polynomial function based on their ID numbers, and then analyze the...
Curated OER
Kinetics of acetone iodination
In this chemistry worksheet, learners examine the given concept in order to apply in the laboratory setting. The sheet includes in depth background information.
Curated OER
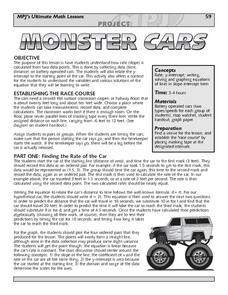
Monster Cars: Slope
Young scholars examine how a rate is calculated from two points. Using battery operated cars, pairs of students measure time and distance. Afterward, they use this data to calculate the rate. Young scholars then plot four ordered pairs...
Curated OER
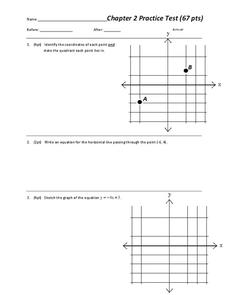
Chapter 2 Practice test
Overall, this worksheet contains a good selection of problems that reviews different aspects of linear equations. Learners examine and graph linear equations, absolute value equations, and inequalities in two variables. The three page...
Curated OER
Off to College
High schoolers investigate linear, quadratic and exponential equations using the TI calculator. They identify relation and functions using ordered pairs, graph the data, analyze the data, and relate it to real-world situations.
Curated OER
Drug Sales Soar - Rate of Change
In this prescription drug worksheet, students answer short answer questions and create graphs on the sales of prescription drugs over a five year span. Students complete six questions.
Curated OER
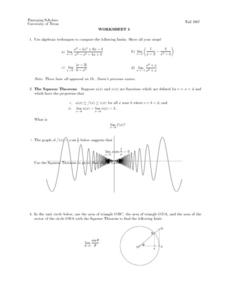
Worksheet 5 - Squeeze Theorem
For this Squeeze Theorem worksheet, students compute limits, identify a graph that represents the Squeeze Theorem, and graph given functions. This two-page worksheet contains seven multi-step problems.
Curated OER
Maximize It!
Students design a rectangular box without a lid that has the largest possible volume using the supplied sheet of centimeter graph paper. They work in groups to construct different size boxes to determine the largest possible volume and...
Curated OER
The Way to Better Grades!
Pupils collect and analyze data. In this statistics lesson, learners create a scatter plot from their collected data. They use, tables and graphs to analyze the data and mae decisions.
Curated OER
Solve-Real roots-Intersections
In this math instructional activity students complete a series of multiple choice questions including calculating intersections using x and y axis.
Curated OER
Linear Equations
For this Algebra I/Algebra II worksheet, students determine the equation of a line given the slope and the coordinates of one point on the line. The one page worksheet contains ten free response questions. Answers are...


