EngageNY
Percent Error Problems
Individuals measure a computer monitor and determine how accurate their measures are. The eighth segment in a series of 20 introduces the concept of percent error. Pupils find the percent error of their measurements and discuss the...
EngageNY
Margin of Error When Estimating a Population Proportion (part 2)
Error does not mean something went wrong! Learners complete a problem from beginning to end using concepts developed throughout the last five lessons. They begin with a set of data, determine a population proportion, analyze their result...
EngageNY
Margin of Error When Estimating a Population Proportion (part 1)
Use the power of mathematics to find the number of red chips in a bag — it's a little like magic! The activity asks learners to collect data to determine the percentage of red chips in a bag. They calculate the margin of error and...
EngageNY
Distance and Complex Numbers 2
Classmates apply midpoint concepts by leapfrogging around the complex plane. The 12th lesson in a 32 segment unit, asks pupils to apply distances and midpoints in relationship to two complex numbers. The class develops a formula to find...
EngageNY
Decimal Expansions of Fractions, Part 1
Is it possible to add infinitely long decimals? As pupils complete the examples in the ninth lesson of this 25-part series, they determine that adding these decimals cannot be done without error. Their task is then to determine the size...
Kenan Fellows
Density
Most scholars associate density with floating, but how do scientists determine the exact density of an unknown liquid? The third lesson in a seven-part series challenges scholars to find the mass and volume of two unknown liquids. Each...
Curated OER
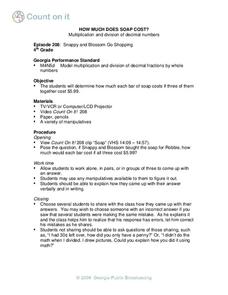
How Much Does Soap Cost?
Explore multiplication and division using real life problems, including how to find the cost of soap per bar. Individuals or small groups work to find answers. They then share with the class how they found their answer.
Illustrative Mathematics
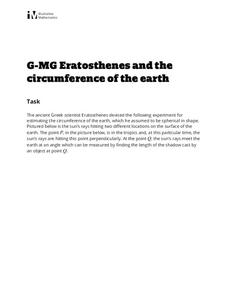
Eratosthenes and the Circumference of the Earth
The class gets to practice being a mathematician in ancient Greece, performing geometric application problems in the way of Eratosthenes. After following the steps of the great mathematicians, they then compare the (surprisingly...
Curated OER
Riemann Rectangle Errors
Students calculate the area under a curve. In this calculus lesson, students integrate the function to find the area under the curve. They use the Ti to create a visual of the graph.
Curated OER
Finding the Area Under A Curve with Random Probability
Young scholars explore the concept of area under a curve. In this area under a curve lesson plan, students find the area under a curve using the Monte Carlo method using random points and probability. Young scholars calculate the area...
Illustrative Mathematics
Accuracy of Carbon 14 Dating II
The scientific issue of carbon-14 dating and exponential decay gets a statistics-based treatment in this problem. The class starts with a basic investigation of carbon content, but then branches out to questions of accuracy and...
Curated OER
Bowling Math
Young scholars calculate bowling scores by using math skills. In this bowling instructional activity, students take a trip to a bowling alley and use a worksheet to figure out bowling scores. Young scholars use prior math skills such as...
Texas Instruments
Math TODAY for TI-Navigator System - Is Leisure Time Really Shrinking?
High schoolers organize data from the USA TODAY Snapshot, "Is leisure time really shrinking?" into two scatter plots and determine the quadratic model for each scatter plot. They determine if these graphs intersect and learn the concept...
Federal Reserve Bank
Your Credit Report
What is your credit score? How do you find it? Help your pupils answer these questions and more. They will access their free credit report and then analyze its meaning.
Curated OER
Applied Science - Science and Math Lab
Learners make a prediction. In this applied science lesson, students guess the number of items in a jar. Learners create a bar graph to show the predictions and the actual amounts.
Curated OER
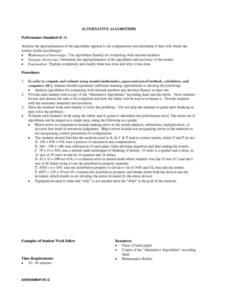
Alternative Algorithms
Analyze algorithms for computing with rational numbers and develop fluency in their use with your math class. They work individually to solve the problems on the "Alternative Algorithms" sheet. Then, they analyze the appropriateness of...
EngageNY
Population Problems
Find the percent of the population that meets the criteria. The 17th segment of a 20-part unit presents problems that involve percents of a population. Pupils use tape diagrams to create equations to find the percents of subgroups...
Howard County Schools
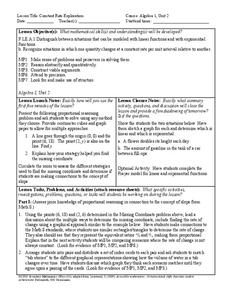
Constant Rate Exploration
Question: What do rectangles and bathtub volume have in common? Answer: Linear equations. Learn how to identify situations that have constant rates by examining two different situations, one proportional and one not proportional.
Curated OER
Using Proportions to Estimate
Students calculate ratio and proportion. In this unit rates instructional activity, students estimate using proportions and find their errors in doing so. They calculate unit rates and define the concept of unit rates.
Curated OER
Opinion Poll-arities
Students explore the mathematics behind opinion polls, as well as provides a framework for interpreting trends in opinion poll graphics.
Curated OER
Measuring the Area of a Circle
When mathematical errors happen, part of the learning is to figure out how it affects the rest of your calculations. The activity has your mathematicians solving for the area of a circular pipe and taking into consideration any errors...
Illustrative Mathematics
Assessing Counting Sequences Part II
Access the instructional counting level of your class by prompting them to recall consecutive numbers within a given number range. Working one-on-one with your students and starting with the number range of 1-10, and working toward the...
Curated OER
Investigation--What's The Number?: Exponents
Eighth graders explore exponents and look for patterns that help to determine the ones place when the base is raised to any power. They use trial and error and seek general solutions. Also, identify patterns in a number sequence.
Illustrative Mathematics
Using Function Notation I
Show learners that function notation and multiplication notation are not the same. In the example, Katie is given a function, C(x), which is the cost of producing x amount of DVDs. Ask learners if Katie can divide the function notation,...


