Noyce Foundation
Ducklings
The class gets their mean and median all in a row with an assessment task that uses a population of ducklings to work with data displays and measures of central tendency. Pupils create a frequency chart and calculate the mean and median....
Chicago Botanic Garden
Unit 4 Pre-Assessment
Pre-assessments are great to help teachers determine what information their classes lack, what misconceptions they have, and how in depth to teach specific concepts. The first in a five-part series is a pre-assessment of middle...
Balanced Assessment
Books from Andonov
To examine mathematical functions in a modeling situation pupils combine quadratic and step functions to represent a presented scenario. They both graph and write a function to represent data shown in a table.
Curated OER
2001 U.S. National Chemistry Olympiad Part I
Sixty multiple-choice questions test on a variety of first year chemistry subjects. In order to succeed, exam takers must be competent with properties of elements, stoichiometry problems, gas laws, bond dissociation, and types of...
Balanced Assessment
Scale Charts
Develop scales using tables. Pupils complete charts to show equivalent scale factors before using the completed tables to determine the sizes of scale drawings. They finish the lesson and demonstrate their understanding by completing a...
Illustrative Mathematics
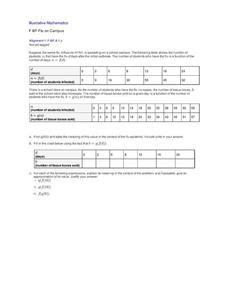
Flu on Campus
An outbreak of the swine flu on a school campus has caused an increase in the number of boxes of tissues sold by the school store. In a real-world-modeling activity, pupils use composition of functions to determine how the number of...
Illustrative Mathematics
Color Week
Practice counting by ones up to 20 with your kindergartners using this colorful class experiment. There are two versions for the lesson. Version 1: The Friday beforehand, send home a notice for the week assigning a different color for...
EngageNY
Changing Scales
Pupils determine scale factors from one figure to another and the scale factor in the reverse direction. Scholars compute the percent changes between three figures.
Mathed Up!
Powers and Square Roots
Square root and exponential powers are the focus of the assessment worksheets included in a math resource. Young mathematicians answer 10 questions, each with subset questions, involving solving a variety of exponential equations...
Illustrative Mathematics
Riding at a Constant Speed, Assessment Variation
Practice ratios and unit rates with tracking how long Lin took to ride her bike. Provided with different questions, your mathematicians can assemble their answers using a chart or setting up ratios. The activity is included in a set of...
New York State Education Department
English Language Arts Examination: June 2015
Many teachers and districts want to give their pupils test-taking practice before state standardized testing occurs. Here's a resource that features a complete exam with numerous passages, a variety of item types, a conversion chart, and...
Mathed Up!
Tallys and Charts
After watching a brief instructional video, young mathematicians are put to the test. By completing and reading frequency tables, tally charts, and bar graphs, individuals show their understanding of how to interpret data.
Mathed Up!
Frequency Polygons
Frequency polygons are a different way to represent frequencies over intervals. Pupils take frequencies for intervals of data from a frequency table and plot them as a frequency polygon. Budding mathematicians find information about the...
New York State Education Department
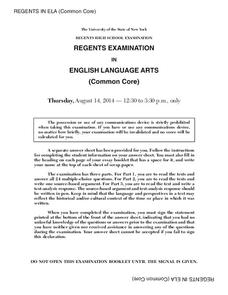
English Language Arts Examination: August 2014
Tired of searching for complex passages suitable for high school level assessments? A challenging examination includes numerous complex text excerpts as well as question items to match them. Learners analyze literary elements, author's...
Charleston School District
Pre-Test Unit 3: Functions
How does an input affect an output? Assess your learners' ability to answer this question using this pre-test. Scholars answer questions about the basics of a function. Topics include determining if a table or statement represents a...
Curated OER
Basketball Rebounds
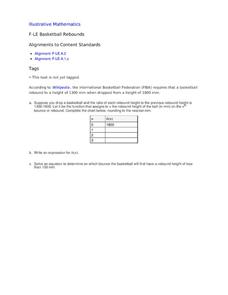
Your young basketball players will build a table and develop a general formula for a decaying exponential scenario involving the rebound distance of a bouncing ball. Using a CBR and graphing calculator can make this even more hands-on...
Other popular searches
- Fill in Angle Charts
- Fill in Percentage Charts
- Fill in Charts
- Fill in the Integer Charts
- Heart Fill in Charts


