CK-12 Foundation
Limiting Factors to Population Growth: Graphing Population Growth
If any of the limiting factors in an environment change, both animal and plant populations also change. The video explains two different models of growth and the impact of limiting factors. It highlights the carrying capacity of an...
National Research Center for Career and Technical Education
Hospitality and Tourism 1: Safety and Sanitation
Math and science come alive in this career-related instructional activity on sanitation. Along the way, learners explore bacterial growth rates using exponential notation and graphs. A link to a very brief, but vivid video shows just how...
Curated OER
Some Similarities between the Spread of an Infectious Disease and Population Growth
If the infectious diseases and population growth instructional activity, students simulate the spread of an infectious disease by exchanging fluids in a lab activity. Students watch the spread of the disease and graph the spread of the...
Curated OER
Graphing the Population Explosion of Weeds
Learners are introduced to the seed cycle and draw the specific steps. In groups, they identify the human barriers to the spreading of weeds. After calculating the rate of spreading of the Yellowstar Thistle, they create graphs to see a...
National Museum of Nuclear Science & History
Nuclear Popcorn
Make your lesson on radioactive decay pop with this lab exercise. Using popcorn kernels spread over a tabletop, participants pick up all of those that point toward the back of the room, that is, those that represent decayed atoms. As the...
Curated OER
Population Biology
In this population worksheet, students will compare two graphs; one graph representing steady rate of growth and the other one showing exponential growth. Students will use these graphs to complete 3 short answer questions.
Curated OER
Human Population Growth
In this human population growth worksheet, students create a graph of human population growth and predict future growth using the data given in a chart. Students identify factors that affect population growth.
Curated OER
Introduction to Graphical Representation of Data Sets in Connection to Cellular Growth
Students practice graphing relationships between variables by studying topics such as exponential growth and decay. They conduct a series of numerical experiments using a computer model and a variety of physical experiments using mold,...
Curated OER
Bacteria and Illness
High schoolers research information on bacterium and their relationship to food borne diseases. In this science lesson plan, students complete internet research to construct and analyze the growth cure of common bacterium...
Curated OER
Scientific Notation III: Linear vs Exponential
Students examine the differences in exponential growth and linear growth of a system. They interpret data on graphs and develop their own charts. They answer discussion questions as well.
Curated OER
Population Biology
In this population activity, students will compare two population growth graphs and complete four short answer questions. Then students will investigate the factors that influence population growth in 8 fill in the blank statements and 4...
Curated OER
Population Patterns
High schoolers study patterns of population growth in an ecosystem and why populations must remain in balance. They interpret basic population graphs and suggest scenarios about different population growth patterns in an ecosystem.
Curated OER
Estimation of Population Growth By Counting Offspring: Seed Multiplication
Students calculate the reproductive rate of a plant that creates multi seed fruits. They graph exponential growth and the complete a series of questions that help them infer that natural selection processes are at work in this population.
Curated OER
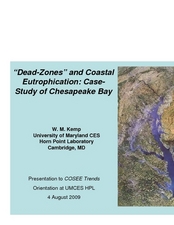
"Dead-Zones" and Coastal Eutrophication: Case-Study of Chesapeake Bay
Take an in-depth look at nutrient loading, eutrophication, and hypoxia using data on The Chesapeake Bay as an example. This comprehensive presentation includes detailed graphs, photos, and details about the changes in marine organism...
Curated OER
How Many Cells Are Born in a Day?
Students predict the number of cells after a series of cell divisions. In this cells lesson students create a graph of their results and create a patterned drawing.
Curated OER
Population Biology - Biology Teaching Thesis
Students explore the effects of different density-dependent and density-independent factors on population growth. They explore how the interactions of organisms can affect population growth. Students explore the pattern of population...
Curated OER
Population Growth
High schoolers investigate the biodiversity of living things and how they are interdependent upon each other. They conduct research using a variety of resources. Specifically students create a graph to show how a population can grow in...
Curated OER
The Dynamics of Populations
Tenth graders analyze the growth rate of different population. For this biology experiment, 10th graders identify the biotic and abiotic factors that limit population size. They create a poster to show their findings in class.
Curated OER
The History and Future of Human Population Growth
Students create a timeline of human population growth based on guided reading. In this biology lesson, students analyze the trend of how population increased over time. They share their findings in class.
Population Connection
The Peopling of Our Planet
How many people live on the planet, anyway? The first resource in a six-part series covers the topic of the world population. Scholars work in groups to conduct research and make population posters after learning about the global...
Curated OER
Introduction to Graphical Representation of Data Sets in Connection with Nuclear Decay
Students record data, make observations, and share in experimentation and discussion of numerical experiments.
Concord Consortium
Concord Consortium: Population Curve: Significance of Breakpoints
Learn about three models of population growth: linear, exponential, and logistic. Then conduct a population experiment to see how populations can work in the real world, and see how linear graphs can help simplify complicated ones.

