Curated OER
How Many Cells Are Born in a Day?
Students predict the number of cells after a series of cell divisions. In this cells instructional activity students create a graph of their results and create a patterned drawing.
Curated OER
Worksheet #6, Exponents, Interest, and Radioactive Decay of Isotopes
For this calculus worksheet, students sketch graphs of given exponential functions. They compute the principal needed to have a given ending balance when the interest is compounded at varying times. Kids use a simple exponential model to...
Agile Mind
Rabbit populations
In this real-world problem about the rapid growth of rabbit populations, students must analyze two different scenarios and create mathematical models to represent them. They use their exponential models to answer questions about the...
Curated OER
Population Biology - Biology Teaching Thesis
Learners explore the effects of different density-dependent and density-independent factors on population growth. They explore how the interactions of organisms can affect population growth. Students explore the pattern of population...
Curated OER
Modeling: Having Kittens
Cats can't add, but they do multiply! Determine the number of descendants of a single cat given specific facts about cats and kittens. The lesson focuses on developing strategies for problem solving using both individual and group work....
Achieve
Ivy Smith Grows Up
Babies grow at an incredible rate! Demonstrate how to model growth using a linear function. Learners build the function from two data points, and then use the function to make predictions.
Curated OER
Population Growth
High schoolers investigate the biodiversity of living things and how they are interdependent upon each other. They conduct research using a variety of resources. Specifically students create a graph to show how a population can grow in...
Curated OER
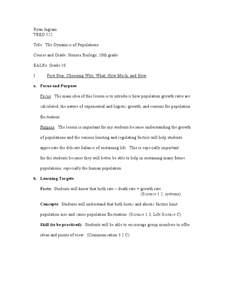
The Dynamics of Populations
Tenth graders analyze the growth rate of different population. In this biology experiment, 10th graders identify the biotic and abiotic factors that limit population size. They create a poster to show their findings in class.
Curated OER
World Population Study
Students explore an exponential relationship and how it relates to human population growth and the current global population crisis. They graph both exponential and linear information.
Curated OER
WORLD POPULATION STUDY
Students explore an exponential relationship and how it relates to human population growth and the current global population crisis.
Curated OER
An Introduction to Functions
Young scholars investigate the growth and decay of an exponential function. In this algebra instructional activity, students apply properties of exponent solve problems. They identify any patterns they see in the graphs.
Curated OER
How Much Data is That?
Middle schoolers differentiate between exponential and logarithmic functions. In this algebra lesson, students use logarithmic properties to solve equations. They identify growth and decay of graphs.
Curated OER
How popular is your favorite site?
Students gather data for the project for the entire year. They plot their data, try to fit a equation to their data, and speculate on why the data shows the pattern it does and project its future growth.
Curated OER
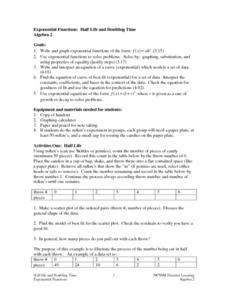
Exponential Functions: Half Life and Doubling Time
Pupils investigate the concept of exponential functions and how they increase in size over time. They simplify the functions in order to find the solutions that are possible and perform analysis of the curved line that is produced when...
Curated OER
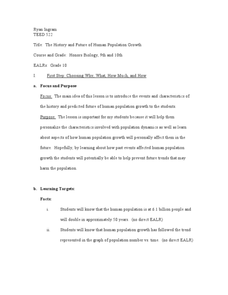
The History and Future of Human Population Growth
Young scholars create a timeline of human population growth based on guided reading. In this biology lesson, students analyze the trend of how population increased over time. They share their findings in class.
Achieve
Spread of Disease
Viruses can spread like wildfire, and mathematics can model the speed of infection. Given a function, scholars analyze it to describe the spread of a disease within a stadium. Learners find the initial number infected and the maximum...
Code.org
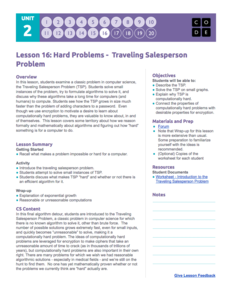
Hard Problems – Traveling Salesperson Problem
Even computers find this to be a hard problem. In the eighth installment of a 12-part unit, young computer scientists learn about the traveling salesperson problem. They formulate algorithms to solve the problem and find out why it is...
Curated OER
Oodles of Poodles
Students solve equations by graphing. In this algebra lesson, students differentiate between functions and relations. They use the TI to graph their equation and analyze the graph.
Curated OER
Population Models and Qualitative Analysis
In this quantitative analysis worksheet, students explore the limits of a rate equation. They use quantitative analysis methods to determine the differential, plot graphs of their values, and describe the relationships between the...
Curated OER
Count The Letters
Students perform activities involving ratios, proportions and percents. Given a newspaper article, groups of students count the number of letters in a given area. They use calculators and data collected to construct a pie chart and bar...
Curated OER
Populations Lab - Exponential Graphing
Ninth graders investigate the application of populations that exists in one's everyday environment, in order to develop an understanding of how mathematics is a key component in the understanding of population dynamics.
Curated OER
Risky Business
Students view a video on AIDS, HIV and the ways in which HIV is spread. They discuss ways to avoid contracting HIV and participate in a simulation that shows the growth of a communicable disease.
Curated OER
Reciprocals of Quadratic Functions
Eleventh graders investigate inverse functions. In this Algebra II lesson, 11th graders use their prior knowledge of linear, exponential,and quadratic functions to create a graph of an equation they have never seen before.
Curated OER
I want a credit card--or do I?
Students pretend to borrow $1000.00 on a credit card. They pretend to make the minimum payments for a year. When they're done, they make a pie chart showing how much of their payments reduced their debt, and how much was interest.


