NASA
Lights on the International Space Station
Groups explore illumination with NASA's Lighting Environment Test Facility (LETF) as a context. Using the TI-Nspire app, groups determine the lux equation that models their simulation. They then use the lux equation to solve problems...
Inside Mathematics
Population
Population density, it is not all that it is plotted to be. Pupils analyze a scatter plot of population versus area for some of the states in the US. The class members respond to eight questions about the graph, specific points and...
Curated OER
Vertical and Horizontal Translations
Eleventh graders study seven functions. They use their handheld calculator to determine which family of functions the equation belongs, the parent function described, and they calculate the vertical and horizontal translation.
Curated OER
Sequence Graphs
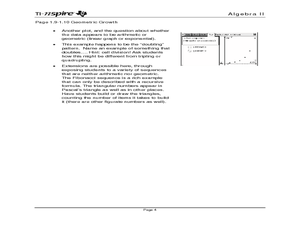
Investigate arithmetic and geometric sequences by using a graphing calculator to determine if a sequence is linear or exponential.
Alabama Learning Exchange
I'm Lovin' It: Finding Area Between Curves
Students explore the concept of finding the area between two curves. In this finding the area between two curves instructional activity, students model the logos of McDonalds, Nike, and Motorola on grid paper. Students find functions to...
Alabama Learning Exchange
Technology for Displaying Trigonometric Graph Behavior: Sine and Cosine
Students explore the concept of sine and cosine. In this sine and cosine lesson, students work in groups to graph sine and cosine functions. Students examine how coefficients in various parts of each parent function shift the graph. ...
Curated OER
Curve Fitting
Pupils investigate linear, quadratic, and exponential regressions. They plot sets of data points, determine the regression equation that best fits the data and lastly investigate the coefficient of determination.
Curated OER
Analyzinf Equations Through Slope and Y intercept
Students solve equations representing exponential functions. In this algebra lesson plan, students interpret their equations by analyzing the slope and y intercept. They find the slope using the slope formula.
Curated OER
Estimating the Square- Root of Ten
In this algebra learning exercise, students estimate the square root. They rewrite the root as an exponential function and solve. They use the correct function notation. There are 10 questions.
Mathematics Assessment Project
College and Career Readiness Mathematics Test C1
Challenge high schoolers with a thorough math resource. The 20-page test incorporates questions from upper-level high school math in applied and higher order questions.
Shodor Education Foundation
Recursion
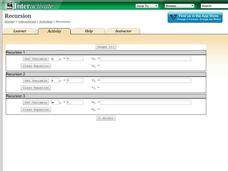
Perform the operation ... and then do it again. Scholars investigate recursive formulas by creating and graphing them. Using the interactive, pupils set the variable, determine the initial value, and type in a recursive formula.The...
Curated OER
Investing
Students collect data on investments and draw conclusions. In this algebra lesson, students analyze exponential graphs as they relate to money. They discuss the cause of an account balance being high or low.
Curated OER
Why Are Hot Things Red?
In this radiation and temperature worksheet, students use 2 methods to derive the Wein Displacement law that shows the relationship between the temperature of a body to the frequency where the Planck curve's value is at its maximum....
Curated OER
Introduction to Solving Quadratic Equations by Factoring
Students solve quadratic equations. In this algebra lesson, students factor and graph linear and quadratic functions. They identify the standard and linear form of each equation.
Curated OER
The Regression Line and Correlation
Students investigate the best fit line through plotting on the TI. In this math instructional activity, students examine their data representing regression lines and correlation. They use interactive technology to differentiate between...
Shodor Education Foundation
Sequencer
Take the first step into graphing sequences. Learners set the starting number, multiplier, add-on, and the number of steps for a sequence. Using the inputs, the interactive calculates and plots the sequence on the coordinate plane. Users...
Flipped Math
Sequences
To say it explicitly—put the terms in order. Pupils learn about the two main sequences, arithmetic and geometric and discover the general explicit formulas for both types. Using the formulas, learners then calculate specific terms of the...
Curated OER
Calculus
Students make an inquiry with the aid of technology into the concept of functions. The emphasis of the lesson is on the interplay between the geometric and analytic information.
Institute of Electrical and Electronics Engineers
Get Connected with Ohm's Law
Ideal for your electricity unit, especially with middle schoolers, this lesson plan gets engineers using multimeters in electrical circuits to explore the relationships among voltage, current, and resistance. Older learners may even plot...
Curated OER
Describing Data
Your learners will practice many ways of describing data using coordinate algebra in this unit written to address many Common Core State Standards. Simple examples of different ways to organize data are shared and then practice problems...
Radford University
A Change in the Weather
Explore the power of mathematics through this two-week statistics unit. Pupils learn about several climate-related issues and complete surveys that communicate their perceptions. They graph both univariate and bivariate data and use...
Inside Mathematics
Snakes
Get a line on the snakes. The assessment task requires the class to determine the species of unknown snakes based upon collected data. Individuals analyze two scatter plots and determine the most likely species for five additional data...
Alabama Learning Exchange
There's Gold in Them There Hills
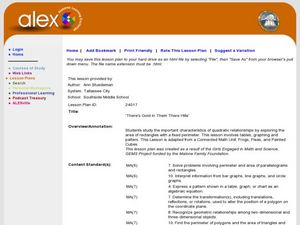
Need to build a laser fence on Mars? In this cute maximizing-area lesson plan, young explorers pretend to be prospectors on Mars and must determine the best way to use 20 meters of fencing in order to maximize their area. In addition,...
Radford University
Sleep and Teen Obesity: Is there a Correlation?
Does the number of calories you eat affect the total time you sleep? Young mathematicians tackle this question by collecting their own data and making comparisons between others in the class through building scatter plots and regression...


