Hi, what do you want to do?
Texas Instruments
Texas Instruments: Taking It to the Limit
Students explore the concept of limits, both finite and infinite, using the graphing calculator. Each rule has a set of examples and a section for the students to try other examples to create a basis of understanding of each of the rules.
Mangahigh
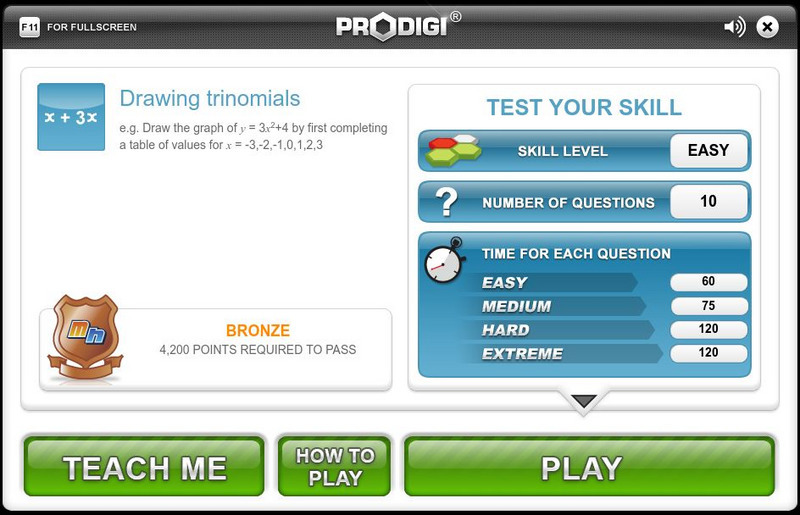
Mangahigh: Algebra: Drawing Trinomials
Students explore an interactive tutorial on drawing trinomials and then practice their knowledge by attempting ten questions that increase in difficulty level.
National Council of Teachers of Mathematics
Nctm: Illuminations: Geogebra: Dynagraphs
Explore relationships between inputs and outputs by manipulating interactive double number lines.
Shodor Education Foundation
Shodor Interactivate: Derivate
Explores derivatives and the idea of infinity using a geometric interpretation of slope.
Khan Academy
Khan Academy: Pixar in a Box: The Art of Storytelling
Explore the storytelling process at Pixar.
Other
Nearpod: What Is Slope?
In this lesson on slope, students explore how the rate of change can be identified using a graph, a set of points, and a table.
Interactive Mathematics
Interactive Mathematics: Quadratic Equations
Using modeling, the world of quadratics is explored. Learn how to solve quadratics using methods of factoring, completing the square, and the quadratic formula. Also included are methods for graphing quadratic functions.
Texas Instruments
Texas Instruments: The Standard Form of a Quadratic Equation
In this activity, students explore the standard form of a quadratic equation, y = ax 2 + bx + c. They explore how the x-intercepts (zeros), y-intercept, and vertex are related to the graph of the standard form of a quadratic function.
University Corporation for Atmospheric Research
Ucar: Project Sky Math
Teachers will be interested to explore the SkyMath module, and the 16 classroom activities at this site. In this program, students will collect and record real-time weather data to analyze. Data analysis, graphing, number relationship,...
Texas Instruments
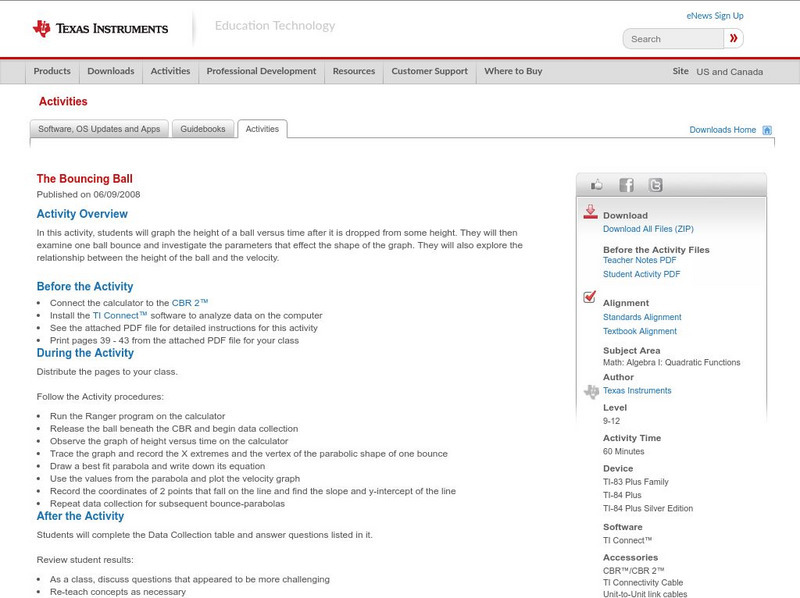
Texas Instruments: The Bouncing Ball
In this activity, students will graph the height of a ball versus time after it is dropped from some height. They will then examine one ball bounce and investigate the parameters that effect the shape of the graph. They will also explore...
CK-12 Foundation
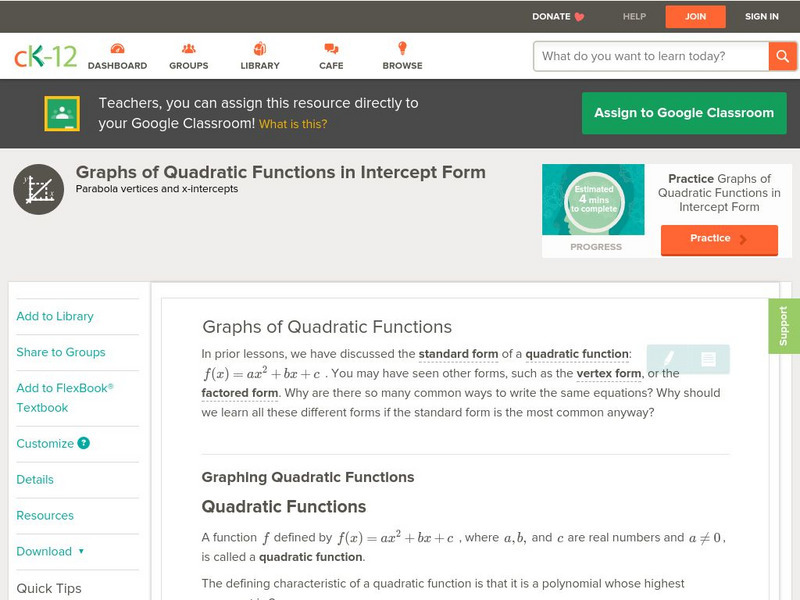
Ck 12: Algebra Ii: 4.2 Right Triangle Trig Extended to Circles With a Model
This section explores the relationship between right triangles, circles, and trigonometry. It investigates how a right triangle that is set inside a circle and rotates around the circle is connected to trigonometric functions and their...
Shodor Education Foundation
Shodor Interactivate: Polar Coordinates
This activity allows the user to explore the polar coordinate system. The applet is similar to GraphIt, but instead allows users to explore the representation of a function in the polar coordinate system.
PBS
Pbs Lesson: Calculate When the Oil Industry Will Dry Up
Students will use the internet to read graphs and solve real world problems regarding the amount of time it will take for the oil to be used up, an exponential function exploration.
Interactive Mathematics
Interactive Mathematics: Differentiation
Explore the world of Calculus through differentiation. Focusing on areas such as limits, tangents to curves, and derivatives, this site shows you how to solve problems based on the discoveries of Sir Isaac Newton and Gottfried Leibniz....
CK-12 Foundation
Ck 12: Analysis: Hyperbola Equations and the Focal Property
[Free Registration/Login may be required to access all resource tools.] Students learn by exploring the focal property and graphing hyperbolas. Students examine guided notes, review guided practice, watch instructional videos and attempt...
TeachEngineering
Teach Engineering: Dams
Through eight lessons, students are introduced to many facets of dams, including their basic components, the common types (all designed to resist strong forces), their primary benefits (electricity generation, water supply, flood...
Texas Instruments
Texas Instruments: General Quadratics, Cubics, and Quartics
This activity explores the characteristics of the graphs of quadratic, cubic, and quartic functions. The graphing calculator will be used to generate graphs and derivatives of these functions.
Texas Instruments
Texas Instruments: Area Under the Curve
In this activity, students explore the relationship between the area under the graph of a function and the integral of the function.
Texas Instruments
Texas Instruments: Numb3 Rs: Close Encounters
Based off of the hit television show NUMB3RS, this lesson has students explore how "closely connected" a network structure is. Framed in the context of a terrorist cell, students must find which setups would allow organizations to still...
Texas Instruments
Texas Instruments: Limits Vertical and Horizontal Asymptotes
This activity explores graphically, numerically and symbolically the vertical and horizontal asymptotes of a rational function through the limit taking capability of the graphing calculator.
Texas Instruments
Texas Instruments: Linear Programming Cookie Dough Kits
In this lesson students explore the concept of linear programming. The students model a real life situation with a system of inequalities and then use their graphing calculators to search for a maximum value for an objective function....
Texas Instruments
Texas Instruments: Classroom Activities: Parachuting
This activity explores a parachutist and her position, velocity and acceleration. Graphing and calculating these functions will be required.
Lawrence Hall of Science
The Math Page: Topics in Precalculus
Designed to help high school students to learn precalculus, topics include the formal rules of algebra, rational and irrational numbers and mathematical induction.


