National Energy Education Development Project
Introduction to Solar Energy
People have been using solar energy for many generations to dry crops, heat homes, and for light. This presentation explains how now it is possible to capture the solar energy and store it for future use, details how and where people use...
NASA
Exploring Data
Bring the sun to your class! Young scholars analyze actual solar wind data in the second lesson of a five-part series. Their analysis includes speed, temperature, and density data.
EngageNY
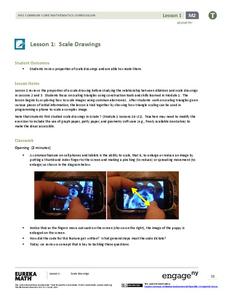
Scale Drawings
Are you searching for a purpose for geometric constructions? Use an engaging approach to explore dilations. Scholars create dilations using a construction method of their choice. As they build their constructed dilation, they strengthen...
Baylor College
Needs of Plants
What better way to learn about plant life than by creating a class garden? Young botanists start with a brief discussion about radishes before planting seeds and watching them grow. To determine the importance of water, sunlight, and...
Cornell University
Diffraction Demystified
Study diffraction patterns using CDs and DVDs! Scholars measure the diffraction patterns of a light wave as it hits a CD or DVD. Using the information, they can measure the distance between the tracks.
Curated OER
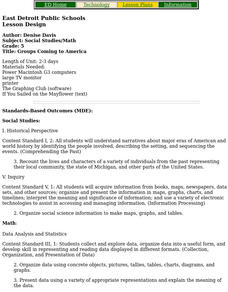
Groups Coming to America
Fifth graders use text or other references to locate different types of information about the Mayflower and pilgrims. They create a presentation for lower elementary classes about the Pilgrims.
Curated OER
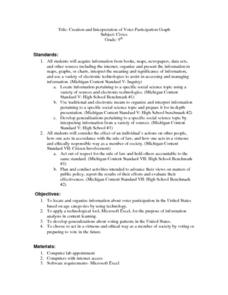
Creation and Interpretation of Voter Participation Graph
Ninth graders research information about voter participation in the United States based on age. They develop generalizations about voting patterns in the U.S and use Microsoft Excel to analyze the information.
Curated OER
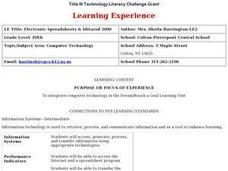
Electronic Spreadsheets & Iditarod 2000
Learners use the Internet for gathering information for Iditarod race journals. They use a spreadsheet program for entering data and making charts for showing changes in speeds achieved over a period of four weeks in timed writings in...
Curated OER
Macbeth Madness
Learners research Macbeth online and complete computer and graphing activities for the play. In this Macbeth activities lesson, students research Macbeth and bookmark the URL's. Learners complete activities for the topic on spreadsheets...
Curated OER
Mathematical Models with Applications: The Sounds of Music
Students use an electronic data-collection device to model the sound produced by a guitar string. They identify the graph of a periodic situation and use the graph to determine the period and frequency of sound waves.
Curated OER
Investigating Transformations Of Parent Functions
Students identify the basic transformations of parent functions. They use their graphing calculator to create a transformation booklet by folding a sheet of computer paper in half and stapling along the folded edge.
Curated OER
Search and Research
Fifth graders participate in a scavenger hunt on the internet trying to develop a general overview of content and how to locate specific information. They also explore how to receive, store and send electronic information.
Curated OER
Hot Friction
Sixth graders use small electronic devices known as thermistors to measure the temperature beneath an object such as a coffee cup as it slides across a surface. By choosing different surfaces, 6th graders can compare in a quantitative...
Curated OER
POWER OF VOTING
Fifth graders explain the process of a national presidential election by researching through the Internet and holding an election simulation. They collect, graph, and interpret election data. They enhance their computer skills by...
Curated OER
What Would You Do Without Nonprofits?
Students research nonprofit organizations within their community. For this nonprofits lesson, students use the yellow pages to identify the number of nonprofit organizations in their community. Students graph the number of nonprofit...
Curated OER
Diffusion & Osmosis with Data Analysis
Students explore principles governing diffusion and osmosis. Students perform a dialysis tubing experiment. They obtain core samples of potato in varying concentrations of sugar-water to measure water potential of the potato cells....
Curated OER
Linear Inequalities
In this algebra worksheet, students solve linear inequalities. They graph their solution on a coordinate plane. There are 6 questions with answer key.
Curated OER
Nonprofits Are Necessaary
Students research community nonprofit organizations. They identify their purposes and graph them. The search telephone books, websites, and magazines for information on local organizations. They write in journals how nonprofit groups...
Curated OER
Systems of Equations
In this algebra worksheet, students factor systems of equations using elimination and substitution. THey graph their lines and find the point of intersection. There are 15 questions.
Curated OER
Amazon Rainforest: You Won't Find George in This Jungle
Learners identify locations of rainforests, compare/contrast layers of the rainforest, construct and interpret maps and graphs, recognize relationships between man and the environment, and write about an imaginary walk in the rainforest.
Curated OER
Trends in Physical Properties of Group 2 Elements
In this elements worksheet, students complete 2 graphic organizers by comparing the element symbol and melting point for given elements. Then students plot a graph of their atomic radius against proton number.
Curated OER
Cancer: A Crisis of the Cells
Students analyze cancer data represented in graphs and charts. They describe the changes in cell structure and function as the result of cancer. They also examine phenomenas that are believed to cause cancer.
Curated OER
Altimetry
Fifth graders accurately measure the distance to eight points on an uneven surface by conducting a simulation of sattelite altimetry. They create a two-dimensional model of the simulated ocean surface by graphing data from the Radar Run...
Curated OER
Growing Barley and Detecting the Presence of Amino Acids
Young scholars produce the greatest mass of plant material possible for 100 seeds of barley, and detect amino acids in barley plant material. They develop rules for the investigation, conduct the experiment, and prepare a computer...


