Curated OER
Regents High School Examination PHYSICAL SETTING CHEMISTRY 2006
The 2006 version of the Regents High School Exam is just as thorough as the rest of them! Assess chemistry learners on an entire year's curriculum when they take this thirteen page test.
Curated OER
Coin Tossing and Graphing
Fifth graders use technology as assistance to collecting random data. Through the random data they will be able to explain the significance of getting a head or tail depending on what was previously landed on. They will then analyze the...
Curated OER
Five Multiple Choice Graphing Inequalities Problems
In this graphing inequalities worksheet, students solve six multiple choice problems regarding inequalities and their graphs. The solutions are provided.
Curated OER
Hollywood's Top Ten
Students gather data on top 10 highest grossing movies, and make a bar graph and a pictogram.
Curated OER
Decisions, Decisions, Decisions
Learners examine graphs to find the most appropriate for various kinds of data. In this graphing instructional activity, student create bar, line and circle graphs. Students create graphs electronically and manually interpreting the data.
Curated OER
Fairy Tales
Sixth graders explore the elements of fairy tales. In this fairy tales lesson, 6th graders analyze several versions of Cinderella from around the world. Students graph fairy tale elements using Excel and create Venn diagrams comparing...
Curated OER
Atomic Fractions-III
In this atomic fractions instructional activity, students read about electrons and energy levels. Students find all the possible energies that an electron could lose as it jumped from one energy level to another based on a given diagram....
Curated OER
Mass Spectrometer
In this mass spectrometer worksheet, high schoolers read about how a mass spectrometer determines the elements in gases around Earth. Students answer 3 questions and identify the elements in a graph found by a mass spectrometer.
Curated OER
Chemistry: elements
In this chemistry activity students complete a set of multiple choice and short answer questions on protons, electrons, ionization and chemical equations.
Fall River Schools
Parabolas Are All Around Us
Moving parabolas off of graph paper and into the real world is the task at hand in this detailed poster project. First, learners perform a cumulative activity identifying many characteristics of an assigned quadratic equation. Next, they...
Learner
Solid Shapes
A collection of two lessons, kindergartners will identify two-dimensional shapes in solid shapes. They will develop basic knowledge of the components that make up a sphere, rectangular prism, pyramid, cylinder, cone, and cube. Young...
Education Development Center
Points, Slopes, and Lines
Before graphing and finding distances, learners investigate the coordinate plane and look at patterns related to plotted points. Points are plotted and the goal is to look at the horizontal and vertical distances between coordinates and...
Curated OER
Solving Systems by Graphing
Young scholars solve systems of equation through graphing. For this algebra lesson, students solve linear equations and analyze the result to figure out if there is one solution, no solution or infinitely many solutions. They graph their...
Curated OER
Fast Food Survey Using Bar Graphs
Second graders conduct survey and sort data according to categories, construct bar graph with intervals of 1, and write a few sentences about their graphs.
Baylor College
Global Atmospheric Change: The Math Link
Change up the classroom atmosphere with this interdisciplinary resource. Following along with the children's book Mr. Slaptail's Curious Contraption, these math worksheets provide practice with a wide range of topics including simple...
Old Dominion University
Introduction to Calculus
This heady calculus text covers the subjects of differential and integral calculus with rigorous detail, culminating in a chapter of physics and engineering applications. A particular emphasis on classic proof meshes with modern graphs,...
Curated OER
Digital Statistics
Research data analysis by creating charts in class. Define the differences between an "average" and "range" while examining measurement data based on student height. Utilize computer software to create a height graph which is shared with...
CK-12 Foundation
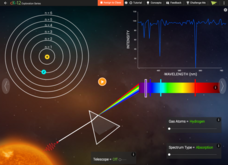
Atomic Colors
Stars are too hot to visit, so how do we know what different stars are made of? An enlightening simulation uses a spectrum graph to show the various electron emission and absorption reactions. Scholars experiment with both helium and...
Curated OER
Ionization Energies in Group I and Period 2
In this electron arrangement worksheet, students complete 2 graphic organizers by determining the proton number of given elements from their first ionization energy. Students plot graphs of first ionization energy against the proton number.
Curated OER
The Lake Effect
Fourth graders conduct an experiment demonstrating the effects of water and air temperature on precipitation. They create graphs demonstrating their findings using Claris Works for Kids.
Curated OER
Bias in Statistics
Students work to develop surveys and collect data. They display the data using circle graphs, histograms, box and whisker plots, and scatter plots. Students use multimedia tools to develop a visual presentation to display their data.
Curated OER
From Playing with Electronics to Data Analysis
Pupils collect and Analyze data. In this statistics lesson, students identify the line of best fit of the graph. They classify lines as having positive, negative and no correlation.
Curated OER
Electron Arrangement
In this ions worksheet, students complete a graphic organizer by filling in the successive ionisation energies for potassium. Then students create a graph plotting ionisation energy against the number of the ionisation energy.
Curated OER
Too Free, Or Not Too Free?
Students create a survey that examines what level of electronic surveillance might be acceptable to members of the school and community. They poll the community, and analyze the results in the form of graphs and a written news article.


