Curated OER
Educate Yourself About Food Borne Illness
High schoolers explore the rules to food safety and how to keep foods from growing bacteria. In this food illness lesson students view a demonstration about bacteria complete a food safety test online.
Curated OER
US Historical Climate: Excel Statistical
Students import US Historical Climate Network mean temperature data into Excel from a station of their choice. They are guided through the activity on how to use Excel for statistical calculations, graphing, and linear trend estimates.
Curated OER
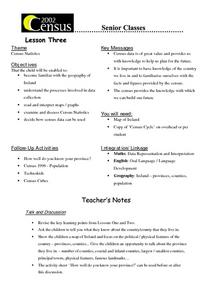
Census Statistics
Twelfth graders become familiar with the geography of Ireland. They explore the processes involved in data collection. Students examine and discuss Census Statistics and read and interpret maps/graphs. They decide how the census data can...
Curated OER
Water Survey
Students investigate water usage for the average home with the help of conducting a home survey. The information is collected and organized into a graphic format. Then they analyze the results to formulate an educated opinion about water...
Curated OER
A Statistical Look at Jewish History.
Eighth graders study the relationship between fractions, decimals and percentages by completing activities. In this research analysis lesson, 8th graders look at different websites to figure out Jewish populations in different situations.
Curated OER
Statistics
High schoolers log their computer usage hours. They determine the mean, median, mode and standard deviation of the collected data. They make a frequency histogram of the grouped data, both on graph paper, and on the TI 83+ graphing...
Curated OER
Global Statistics
Learners select appropriate data to determine the mean, median, mode and range of a set of data. They calculate the statistical data on literacy rates and life expectancy within each geographic region of the world. Students determine...
Curated OER
Catches and landed value of fish
Students analyze data. In this secondary mathematics lesson, students read and retrieve data from a statistical table on the Canadian fishing industry. Students interpret and describe data in mathematical terms and make...
Curated OER
Statistical Sampling
Students collect data in the field and analyze it in class using tables and graphs to determine how many observations of a phenomenon are necessary to draw valid conclusions.
Texas Instruments
Measure Up!
Statisticians take things to new heights using a set of height measurements. Students use TI-82 or TI-83 calculators to determine extreme values and the median for the data. They also construct a box-and-whisker plot to summarize the...
Curated OER
TI-89 Activities for PreCalculus and AP Calculus
Using the TI-89 calculator, young scholars explore the statistical, graphical and symbolic capabilities of the TI-89. Students investigate topics such as solving systems of equations, finding inverse functions, summations,...
Curated OER
Committing to Respect: Lessons for Students to Address Bias
Here's a guide designed to build safe, respectful learning environments, and to build understanding of the value of diversity through lessons packed with activities for specific grade levels.
Teaching Tolerance
The Truth About Voting
True or False: Only Presidential elections matter. Academics delve into common voting myths to understand what is true and why the election process is critical to democracy. The lesson uses group discussion, activities, and handouts to...
Curated OER
Paying Off Student Loans
Young scholars plan financing postsecondary education and explain how loan repayments work. They build a spreadsheet, listing the categories of expenses in the left hand column.
Curated OER
Pick a Pet
Learners design informational materials to educate people on the importance of matching a new pet to the family's lifestyle and living arrangements. Students use critical thinking skills to make a decision on the appropriate choice for a...
Curated OER
Student Costs Data Table
Learners compare and contrast two routes selected for a virtual field trip. They create a data table of educational activities, lodging, and meal costs using Microsoft Excel software.
Curated OER
Hurricanes
Pupils research the formation and life-span of hurricanes and, after analyzing statistics, try their hand at plotting and predicting the course a hurricane.
Curated OER
Kinzi Deaf Alumni
Students use data of school alumni to create a database. The lesson uses technology and access to a computer lab is essential. The concepts of graphing statistics is also used to help teach across the curriculum.
Curated OER
Candy Colors: Figuring the Mean, Median, and Mode
Students count candy by color and then calculate mean, median, and mode. They count candy and use the data to calculate mean, median, and mode (by color) and apply their learning to another collection of data.
Curated OER
Popcorn Nutrition
Students read a snack nutrition chart and answer questions. They compare nutrition levels of snack foods. They correctly calculate differences in nutritional value.
Curated OER
Party, Party, Party
Second graders conduct investigations with counting, comparing, organizing, analyzing, displaying and interpreting data. They pose questions for investigation and collect the data. Students display the data in tally charts, uniform...
Curated OER
Great Tasting Shapes
Fifth graders investigate the concept of median, mode, and range using a simple model for display purposes. They examine different shaped crackers out of a box and identify the ones that occur the most. Then the calculations for the...
Curated OER
Getting A Grip On Graphs
Fourth graders investigate the concept of graphing and comparing different types of data using pictographs, line graphs, scatter plots, etc... They gather data and make interpretations while examining the medium of how it is displayed.
Curated OER
Doing The School Run
Young scholars explore finding the percent of a numbers. They survey their peers to determine modes of transportation used in getting to school. Afterward, students organize information and create graphs and charts. They explore...


