Curated OER
Usage and Interpretation of Graphs
Students review graphing and use processing skills to solve problems.
Curated OER
Let's Graph It! Pre-Test
In this graphing worksheet, students complete a set of 10 multiple choice questions, clicking on a link to see correct answers or print the page.
Curated OER
Straight Line Graphs
Students discover certain equations produce straight lines. In this graphing lesson, students draw axis and problem solve to find coordinates to graph.
Curated OER
Data Analysis Challenge
In this data analysis worksheet, young scholars work with a partner to collect information for a survey. The information is then compiled into a graph. Young scholars must indicate their survey question, the target audience, predict the...
Curated OER
Chapter 7 Word Search
In this statistics worksheet, students locate and identify various vocabulary terms related to mathematics and statistics. There are seven words located in the puzzle to find.
Curated OER
Ornithology and Real World Science
Double click that mouse because you just found an amazing lesson! This cross-curricular Ornithology lesson incorporates literature, writing, reading informational text, data collection, scientific inquiry, Internet research, art, and...
Curated OER
Reading Graphs
Students read graphs and charts to interpret results. In this algebra lesson, students interpret bar, line and pictographs. They draw conclusions and make predicitons based on these charts.
Illustrative Mathematics
Walk-a-thon 1
Your mathematician's job is to explore the relationship between hours and miles walked during a walk-a-thon. The activity compels your learners to experiment with different means in finding out this proportional relationship. The answer...
Curated OER
Let's Graph It
For this let's graph it worksheet, student interactively answer 10 multiple choice questions about graphing data and types of graphs, then click to check their answers.
Curated OER
Untraceable Exercise
In this tracing worksheet, students trace lines, figures, and letters and explain if they could or could not trace them. Students complete 9 problems.
Curated OER
How's the Weather
"How's the Weather?" is an exercise that combines science and math as students graph the weather along the Iditarod Trail. They complete a double-line graph of the weather of a chosen checkpoint over the course of one week. Students...
Curated OER
A Bar of Many Colors
Second graders use colored candies to collect data, construct double bar graphs, and find averages.
Curated OER
ou are the Researcher!
Students conduct a census at school. They collect data, tally it, and create a frequency table. Students display their data in three different types of graphs. They write complete sentences describing the graph.
PBL Pathways
College Costs
Predict the year that college costs will double in your state using linear modeling. The first part of this two-part project based learning activity asks young mathematicians to use data from the College Board. They graph the data, write...
Curated OER
Geometric Sequences - Bacterial Growth
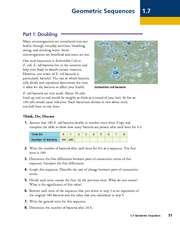
Bring algebra to life with scientific applications. Math minded individuals calculate and graph the time it takes a bacterium to double. They discuss geometric sequences and use a chart to graph their findings. There are 38 questions all...
Curated OER
Math - Blank Jeopardy
Double Jeopardy! Review polynomials, statistics, triangles, graphing, mode, median, mean, measurement, slope, distance, and ratio. Note: Have everyone use a white board to do the problems to get a quick check on understanding.
Curated OER
College Prep Algebra, Worksheet Chapter 3, 2.5, 2.7, 3.1- 3.4
In this algebra worksheet, pupils translate 39 word problems into algebraic terms and solve them. They complete 42 problems about coordinate graphing, working with ordered pairs, slop, and equations of lines.. They make 2 scatter grams...
Curated OER
Raisin the Statistical Roof
Use a box of raisins to help introduce the concept of data analysis. Learners collect, analyze and display their data using a variety of methods. The included worksheet takes them through a step-by-step analysis process and graphing.
Curated OER
Data Analysis of Ground Level Ozone
Sixth graders construct and interpret graphs from ozone data collected in Phoenix area. Can be adapted to other areas.
EngageNY
Mid-Module Assessment Task: Pre-Calculus Module 4
Challenge scholars to show what they know about properties and addition and subtraction formulas for trigonometric functions. The resource provides a mid-unit check on the progress toward mastery of trigonometric concepts. The areas...
Alabama Learning Exchange
Scaling Down the Solar System
Learners work collaboratively to gain a better understanding of the vastness of space by scaling down the solar system. They measure by inches, gain an understanding of space, and model the distances of the planets from the sun.
EngageNY
Conversion Between Celsius and Fahrenheit
Develop a formula based upon numerical computations. The 31st part of a 33-part unit has the class determine the formula to convert a temperature in Celsius to a temperature in Fahrenheit. They do this by making comparisons between the...
Curated OER
Sizing Pumpkins
Fifth graders study the sizes of pumpkins. They measure and record the diameters of pumpkins. They create five subtraction problems and solve them. They weigh their pumpkins, record the data and select two pumpkins to make a graph of...
Curated OER
Can you Find the Expression
Students collect data from measurements and weights for this experiment. In this algebra lesson, students analyze graphs they create form their data to find the expression representing the data. They label which graph provided the best...


