Shodor Education Foundation
Plop It!
Build upon and stack up data to get the complete picture. Using the applet, pupils build bar graphs. As the bar graph builds, the interactive graphically displays the mean, median, and mode. Learners finish by exploring the changes in...
Statistics Education Web
Population Parameter with M-and-M's
Manufacturers' claims may or may not be accurate, so proceed with caution. Here pupils use statistics to investigate the M&M's company's claim about the percentage of each color of candy in their packaging. Through the activity,...
EngageNY
End-of-Module Assessment Task: Grade 7 Mathematics Module 5
Show learners how to use simulations and random sampling to reach conclusions with the last resource in a 25-part series. The assessment contains three scenarios, each with several parts, and covers comparing populations using random...
EngageNY
Variability in a Data Distribution
Scholars investigate the spread of associated data sets by comparing the data sets to determine which has a greater variability. Individuals then interpret the mean as the typical value based upon the variability.
Curated OER
Giant Mystery
Third graders determine the relationship between hand size and body size using centimeters as the unit of measure, They use the relationship to find the size of a hypothetical giant. They graph the measurements using a spreadsheet program.
Curated OER
Decisions, Decisions, Decisions
Learners examine graphs to find the most appropriate for various kinds of data. In this graphing instructional activity, student create bar, line and circle graphs. Students create graphs electronically and manually interpreting the data.
Curated OER
Review Graphing Parabolas & Circles
Students review how to graph parabolas. They practice graphing two different parabolas using the vertex and table method. They solve problems related to graphing circles, determining the radius and the center.
Math Sphere
Co-Ordinates
Challenge young mathematicians' understanding of the coordinate plane with this series of skills practice worksheets. Offering 10 different exercises that involve identifying ordered pairs, graphing polygons, and rotating/reflecting...
West Contra Costa Unified School District
Solving Inequalities
What does translating points on a number line have to do with solving inequalities? Young mathematicians first learn about translations of points on a number line, and then use this information to solve linear inequalities in one variable.
Curated OER
Measure of Spread
Students identify the standard deviation. In this statistics lesson plan, students find the mean distribution and calculate the percent of deviation from the mean. They observe this change on the Ti calculator.
Curated OER
Sampling Distributions
Students analyze sampling from different population. For this statistics lesson, students define the meaning of sample sizes and what causes an increase or decrease. They graph their data on the Ti calculator and draw conclusion from the...
Curated OER
Basic Algebra and Graphing for Electric Circuits
In this electronics worksheet, students evaluate mathematical expressions to complete 16 short answer and problem solving questions.
Curated OER
Asteroids Between Mars and the Sun
In this asteroids of the solar system worksheet, students observe a diagram showing all the minor planets found in the orbit of Mars. Students answer 4 questions about the minor planets inside the orbit of other planets, they find the...
Curated OER
Give Me A Break!
Students create and conduct a survey. In this broken bones lesson, students discuss if they've ever broken a bone and how a broken bone heals. Students generate questions for a survey on broken bones and healing time, conduct the survey...
Curated OER
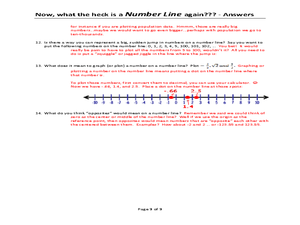
Now, what the heck is a NUMBER LINE again???
A unique approach to reviewing number lines and how to locate different values on them, this instructional activity poses several questions that require written answers rather than calculations. You could use this as a note-taking guide...
Curated OER
Number Sense and Operations
In this number sense and operations instructional activity, students solve 15 different problems that include number lines and identifying various types of numbers. First, they solve a given equation and then check their work. Then,...
Curated OER
Explore Learning - Mean , Median and Mode Gizmo
Sixth graders experiment with mean, median, and mode. In this online interactive mean, median, and mode activity, 6th graders analyze the results of multiple experiments and after they work in groups completing the median, mode, and mean...
Curated OER
Chart problems involving car defects and customer service departments
In this interactive activity, learners solve two problems using the charts provided. Students must convey they are able to understand charts and how to read them.
Curated OER
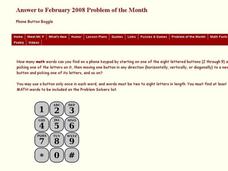
Phone Button Boggle
In this phone button boggle worksheet, students identify the number of math words they can find on a phone keypad according to given directions. This one-page worksheet contains one problem. Answers are provided.
Curated OER
Graphing Parabolas and Circles
Students graph parabolas and circles. For this algebra lesson, students create a table of values and graph the coordinate pairs to create a graph. They graph a circle using the radius and center.
Curated OER
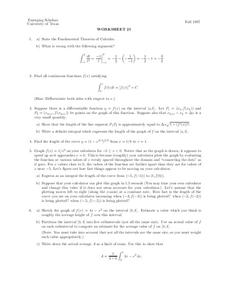
Worksheet 25
In this math worksheet, students state the Fundamental Theorem of Calculus. Then they evaluate the functions and test them against the theorem.
Curated OER
Data and charts
In this data and charts activity, students answer multiple choice questions referring to different charts about mountain heights, breakfast drinks, and more. Students complete 10 multiple choice questions.
Curated OER
Making Connections
Eighth graders investigate the input/output model for building function tables. From the data, 8th graders connect tables, graphs, function rules, and equations in one variable. They work backwards to determine function rules for given...
Curated OER
MA 439-Math of Image Processing
In this image processing worksheet, students use a matrix to solve ten problems. For the first six problems, students are guided to the answer by carefully sequenced questions. The final four problems require students to make a series of...


