EngageNY
Graphs of Linear Functions and Rate of Change
Discover an important property of linear functions. Learners use the slope formula to calculate the rates of change of linear functions. They find that linear functions have constant rates of change and use this property to determine if...
Curated OER
An Exploration of the Slope of a Line
Students define the slope of a line. In this algebra lesson plan, students differentiate between parallel and perpendicular lines using their slopes. They rewrite equations in slope intercept form and explain the meaning of the slope.
Curated OER
Slope of a Line
Students identify the slope of a line. In this algebra activity, students discover the process of how to find the slope of a line and classify the slope as positive, negative, zero or undefined. They find the slope of a line given two...
Curated OER
Solving Using Linear Equations
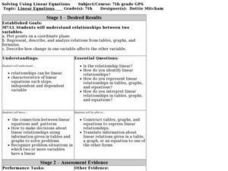
Seventh graders explore linear equations. They observe the relationship between linear equations an patterns. Students make decisions using information given in graphs to solve linear equations. They perform a toothpick activity to...
5280 Math
Triangle Area Patterns
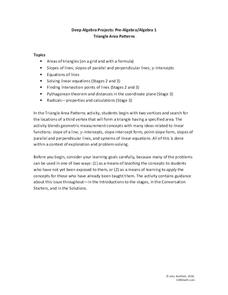
Combine algebraic and geometric strategies to find solutions. The task asks learners to find the coordinates of a third vertex of a triangle to create a triangle with a specific area. The project is a set of seven problems that helps...
Curated OER
Solving Systems of Equations
Students identify the quadrants and axis of a coordinate plane. In this algebra instructional activity, students discover the ocrrect way to graph using the coordinate plane. They discuss the relationship between x and y values, domain...
Center of Excellence for Science and Mathematics Education
A Sick Astronaut
Aspiring astronauts graph, interpret, and analyze data. They investigate the relationship between two variables in a problem situation. Using both graphic and symbolic representations they will grasp the concept of line of best fit to...


