Curated OER
Louisiana Voices Venn Diagrams
In this graphic organizer worksheet, students follow the step-by-step directions in order to use a Venn diagram to compare and contrast two topics.
Curated OER
Literary Response and Analysis: Romeo and Juliet's
Tenth graders complete characterization analysis for Shakespeare's Romeo and Juliet. In this characterization lesson, 10th graders work in learning tiers to analyze the characters and plot in the play. Students work under, at, and above...
Curated OER
Worksheet for Analysis of a Written Document
In this primary source analysis worksheet, learners respond to 16 short answer questions that require them to analyze the provided historical document.
Curated OER
Statistical Diagrams
In this statistics activity, students explore five activities that require analysis and interpretation of maps, charts, and scatter plots. The six page lesson includes five activities or experiments with short answer questions. Answers...
Curated OER
Re-Presenting Race in the Digital Age
Teen-aged scientists analyze a graphic organizer of how trash is removed from New York City and then answer standard questions about a graph and a diagram. Resources are mentioned, but there are no links to these resources, so you will...
Curated OER
Maps and Modes, Finding a Mean Home on the Range
Fifth graders investigate data from maps to solve problems. In this data lesson, 5th graders study maps and collect data from each map. Students present their data in a variety of ways and calculate the mode, mean, median, and range.
Curated OER
Elements of a Story - Plot, Characters, and Setting
Use this SMART board activity with any short story in your unit plan. The SMART board file contains a step-by-step guide to plot diagrams, including an interactive practice page and an assignment. This resource is beneficial for language...
Curated OER
Raisin the Statistical Roof
Use a box of raisins to help introduce the concept of data analysis. Learners collect, analyze and display their data using a variety of methods. The included worksheet takes them through a step-by-step analysis process and graphing.
Curated OER
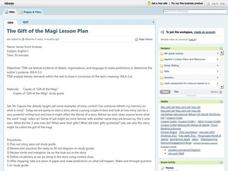
The Gift of the Magi
Test the true meaning of giving - and irony - with this lesson about "The Gift of the Magi." Using textual analysis, details, and text organization, middle schoolers make predictions about future events in the story and determine the...
Curated OER
Unit VII Energy: WS 3a Energy Transfer and Storage
Here is a nifty worksheet on energy transfer. Physics fanatics analyze a diagram and state whether or not friction is involved. They sketch bar graphs and draw energy flow diagrams for each system as well. Circular motion, movement up...
Curated OER
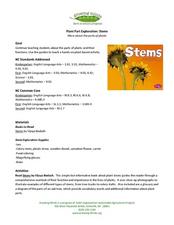
Plant Part Exploration: Stems
Explore water transport in plant stems using this fun experiment! Your scientists will start by reading Stems by Vijaya Bodach. Then, activate prior knowledge about plant stem functions and water transportation. Demonstrate this concept...
Curated OER
Regents High School Examination: Living Environment 2009
Emerging ecologists need a full understanding of life, from the inner workings of a cell to the complex relationships among organisms. This examination is meant to assess high schoolers after an entire year course on the living...
Inside Mathematics
Scatter Diagram
It is positive that how one performs on the first test relates to their performance on the second test. The three-question assessment has class members read and analyze a scatter plot of test scores. They must determine whether...
PHET
Soda Bottle Magnetometer
Introduce learners to set of complete instructions that describe how to build a magnetometer that works just like the ones professional photographers use to predict auroras. The diagrams are wonderfully descriptive, and the written...
EngageNY
Notices and Wonders of the Second Stanza of “If”
Here is an instructional activity that asks pupils to analyze poetry and sparks discussion about two different types of texts: asking how is the poem, If by Rudyard Kipling alike and different from the story, Bud, Not Buddy by...
Curated OER
It's Your Life - Safe or Sorry/Safety Issues
Young scholars examine and chart data about safety hazards and unsafe situations. In this safety hazard lesson, students examine newspapers and web sites to investigate injuries from safety hazards. They make a spreadsheet using the data...
Noyce Foundation
Double Down
Double the dog ears, double the fun. Five problems provide increasing challenges with non-linear growth. Topics include dog ears, family trees and population data, and geometric patterns.
Curated OER
Completing frequency diagrams from displayed data
In this frequency activity, students use data in graphs and charts to complete a frequency diagram. Students fill in 26 spaces in the diagram.
Curated OER
When Do You Brush Your Teeth? --Class Venn Diagram
In this math worksheet, students collaborate to make a tally mark Venn diagram which shows what time of day students brush their teeth: morning, evening or both.
Curated OER
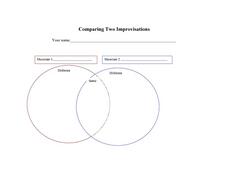
Comparing Two Improvisations
Jazz improvisation can be difficult to listen to for some music enthusiasts, however there are patterns and characteristics that can be analyzed. They use this Venn diagram to aid them in comparing two improvisational pieces, where they...
Curated OER
Catcher in the Rye: Chapters 18-20 Venn Diagram
Well into Catcher in the Rye, when things are looking bleak and your readers may be needing some levity, read the picture book The Perfect Square by Michael Hall. Then use the Venn diagram included to compare how Holden Caulfield and the...
Curated OER
The Gathering and Analysis of Data
Young mathematicians gather data on a topic, graph it in various forms, interpret the information, and write a summary of the data. They present their data and graphs to the class.
Curated OER
Make a Frequency Table and a Histogram for a Given Set of Data
In this data recording and data organization worksheet, students create one frequency table and one histogram for a given list of data. Explanations and examples for frequency tables and histograms are given.
EngageNY
From Ratio Tables, Equations and Double Number Line Diagrams to Plots on the Coordinate Plane
Represent ratios using a variety of methods. Classmates combine the representations of ratios previously learned with the coordinate plane. Using ratio tables, equations, double number lines, and ordered pairs to represent...


