Curated OER
Digger and the Gang
Help online friends Digger and Sprat from the BBC series to solve math problems! In a series of activities, your class will use data sets to calculate measurements, averages, means, and probabilities. The class completes worksheets and...
Curated OER
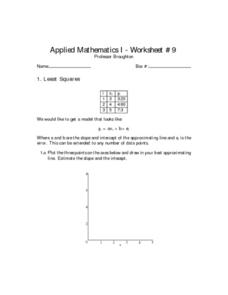
Least Squares
In this least squares worksheet, students solve 6 different problems that include the least squares of numbers. First, they plot 3 points on the axes shown and draw in their best approximating line. Then, students estimate the slope and...
Curated OER
Number Pairs
As you introduce graphs and coordinate pairs, use this guided activity to get scholars started. They reference an example before recording number pairs to identify the location of 12 letters on a grid. Next, learners examine shapes on a...
Polar Trec
Polar Detectives: Using Ice Core Data to Decode Past Climate Mysteries
How does examining an ice core tell us about weather? Learners set up and explore fake ice cores made of sugar, salt, and ash to represent historical snowfall and volcanic eruptions. From their setups, scholars determine what caused the...
Utah Education Network (UEN)
Insides and Outsides
Give small groups handfuls of unit cubes and then dare them to build as many rectangular prisms as possible using only 12 cubes. This engaging activity serves as an introduction to the volume of solid figures. In addition to volume,...
Howard Hughes Medical Institute
Mendelian Genetics, Probability, Pedigree, and Chi-Square Statistics
People with the sickle cell trait, but not sickle cell disease, find natural protection against malaria. Scholars consider various combinations of genotypes and environmental factors to determine if children might have sickle cell...
Biology Corner
Pipe Cleaner Babies
Ever been told you have your father's eyes? How did it happen? Young biologists get a hands-on experience in meiotic gene expression with a fun pairs-based activity. Participants use pipe cleaner chromosomes with trait beads to make...
Towson University
Mystery Disease
How did scientists determine the cause of illness before technology? Science scholars play the role of medical researcher in an engaging guided inquiry activity. Using observations, technical reading, and Punnett squares, learners...
Curated OER
Square Dances
If you are teaching square dancing, this word search puzzle provides 30 related terms to locate. Definitions are not included.
EngageNY
Modeling Relationships with a Line
What linear equation will fit this data, and how close is it? Through discussion and partner work, young mathematicians learn the procedure to determine a regression line in order to make predictions from the data.
Howard Hughes Medical Institute
The Teosinte Hypothesis
Don't want to sound corny, but your class will be a-maize-d by an engaging activity! Explore the history of the modern corn plant through a video and Punnett squares. Junior genetics experts get hands-on experience with actual research...
Western Kentucky University
Understanding Genetics: Punnett Squares
Can scientists really predict genetic outcomes or are they simply making a lucky guess? Scholars first learn about Gregor Mendel and how to make Punnett squares. Then they extract DNA from a strawberry in a lab with included conclusion...
University of Georgia
Monohybrid Crosses and The Punnett Square Lesson Plan
Looking for a quick, hands-on activity to teach young scientists about Punnett squares through monohybrid crosses? then check out this one.
Curated OER
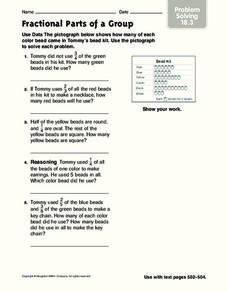
Fractional Parts of a Group
In this problem solving worksheet, students problems solve the answers to 5 mathematical word problems involving fractional parts. Students use data from a pictograph to assist them in solving each word problem.
Howard Hughes Medical Institute
Using Genetic Crosses to Analyze a Stickleback Trait
Two fish appear different, but how do scientists determine their genotypes? Scholars practice performing test crosses to determine the genotypes of fish given their phenotypes. They answer in-depth comprehension questions and complete...
Curated OER
Calculating Baseball Statistics
Students calculate baseball statistics. In this data analysis lesson plan, students use baseball statistics to calculate the batting average and slugging percentage. Students visit www.funbrain.com to play a math baseball game.
Curated OER
Probability
Here is a classic activity used to introduce your class to the concept of probability and data collection. They will roll one die 30 times, then record and discuss the results. Great introduction, but too shallow to be considered a...
Exploratorium
Jacques Cousteau in Seashells
Visionaries create images out of dots to demonstrate the eye-brain connection. Through this activity, they learn that the brain interprets data collected by the eye into recognizable information. Search online for "Jacques Cousteau in...
Cornell University
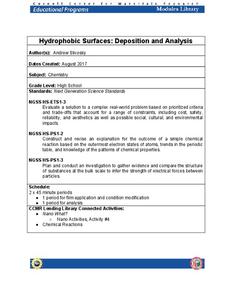
Hydrophobic Surfaces—Deposition and Analysis
Couches, carpets, and even computer keyboards now advertise they are spill-resistant, but what does that mean? Scholars use physical and chemical methods to coat surfaces with thin films to test their hydrophobic properties. Then they...
Statistics Education Web
The Case of the Careless Zookeeper
Herbivores and carnivores just don't get along. Using a box of animal crackers, classes collect data about the injury status of herbivores and carnivores in the box. They complete the process of chi-square testing on the data from...
EngageNY
Analyzing Residuals (Part 1)
Just how far off is the least squares line? Using a graphing calculator, individuals or pairs create residual plots in order to determine how well a best fit line models data. Three examples walk through the calculator procedure of...
Inside Mathematics
Snakes
Get a line on the snakes. The assessment task requires the class to determine the species of unknown snakes based upon collected data. Individuals analyze two scatter plots and determine the most likely species for five additional data...
Noyce Foundation
Granny’s Balloon Trip
Take flight with a fun activity focused on graphing data on a coordinate plane. As learners study the data for Granny's hot-air balloon trip, including the time of day and the distance of the balloon from the ground, they practice...
Radford University
A Change in the Weather
Explore the power of mathematics through this two-week statistics unit. Pupils learn about several climate-related issues and complete surveys that communicate their perceptions. They graph both univariate and bivariate data and use...


