CK-12 Foundation
Single Bar Graphs: Hockey Teams
Raise the bar for hockey fans. Using data about favorite hockey teams, pupils build a bar graph. They use the information from the graph to make comparisons and solve one- and two-step problems.
CK-12 Foundation
Two-Sided Stem-and-Lead Plots: Gamers
Which gender spends more time playing video games? Your classes use provided data to answer this question. They first build a two-sided stem-and-leaf plot and then use the display to look for patterns. Guiding questions help them...
Shodor Education Foundation
Multiple Linear Regression
You'll have no regrets when you use the perfect lesson to teach regression! An interactive resource has individuals manipulate the slope and y-intercept of a line to match a set of data. Learners practice data sets with both positive and...
CK-12 Foundation
Understand and Create Histograms: Histograms
Determine the shape of weight. Using the interactive, class members build a histogram displaying weight ranges collected in a P.E. class. Scholars describe the shape of the histogram and determine which measure of central tendency to use...
Shodor Education Foundation
Scatter Plot
What is the relationship between two variables? Groups work together to gather data on arm spans and height. Using the interactive, learners plot the bivariate data, labeling the axes and the graph. The resource allows scholars to create...
Curated OER
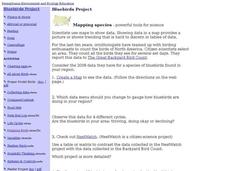
Bluebirds Project: Mapping Species
In this bluebirds project: mapping species worksheet, students create a map based on data for bluebirds in their area, then answer 5 questions about the mapping of the species. This page has numerous links to helpful web...
Curated OER
Milkweed and Monarch Butterfly Mania: Measuring
In this milkweed and monarch butterfly mania: measuring learning exercise, students use photos of milkweed plants and caterpillars next to a ruler to estimate the measurements of 10 leaves and 15 caterpillars, calculating and...
Curated OER
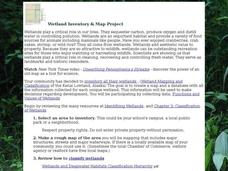
Wetland Inventory and Map Project
In this wetlands inventory and map project activity, students do research on the wetlands and complete a map project about it. Students follow 6 sets of directions with Internet links.
Curated OER
Pints and Quarts
For this measurement worksheet, students study the sets of pints or quarts for the 7 problems. Students circle the set of measurements that are less.
American Museum of Natural History
Rising CO2! What Can We Do?
It is colorless and scentless, but it makes a large impact on the environment. Learners explore carbon dioxide emissions and what they mean for the environment using an interactive graph. They review changes over time and how they impact...
Curated OER
Elbow Room - Exploring Population Density
In this population worksheet, students click on the links and research the internet about population, land, and government. Students answer 16 short answer questions including making spreadsheets.
Curated OER
Milk and Monarch Butterfly Mania Journal Entry
In this milk and monarch butterfly mania journal entry activity, students write a scientific journal entry about the milkweed plant, using the information from another linked website. This activity includes many links to other web...
ABCya
Ab Cya: It's Glow Time Mean, Median, Mode, & Range
Want to have fun while learning Mean, Median, Mode, and Range? Well... It's Glow Time! In this game kids can play a favorite arcade game to earn tickets and points, and then analyze the data. Type in the correct answers to enter Free...
US Department of Education
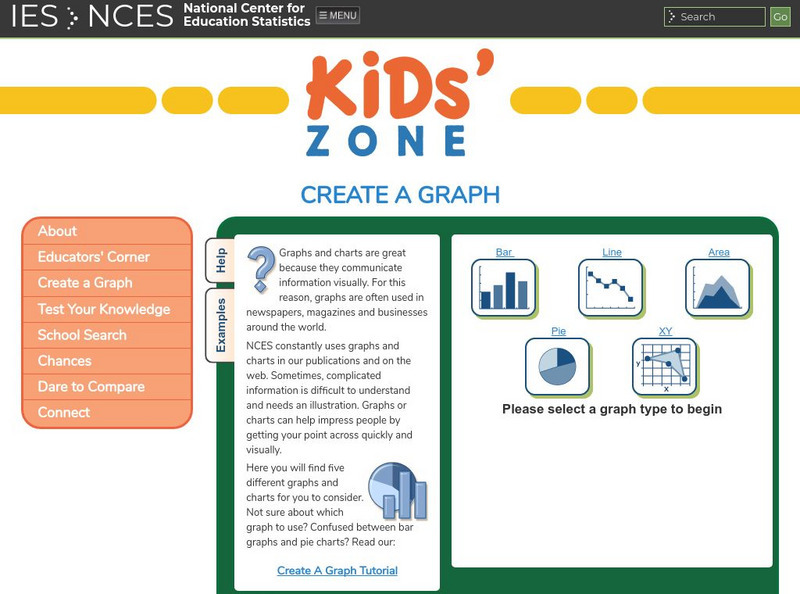
Nces Kids: Create an Xy Graph
This is where you can find a step by step explanation of how to create an XY graph. When you finish each step just click the next tab and you will find the next set of instructions.


