Space Awareness
The Climate in Numbers and Graphs
Weather versus climate: weather relates to short time periods while climate averages the weather of a period of many years. Scholars learn about average temperature and precipitation in various climate zones and then apply statistics...
Curated OER
Earthquake Epicenter
Students use chart data to determine the location of the epicenter of an earthquake. This task assesses students' abilities to generalize and infer, organize data, interpret data, and apply mathematical concepts.
Curated OER
Spyglass Transform
Learners transfer information previously saved in a spreadsheet to Spyglass Transform. They visualize the data and explain what it means
Curated OER
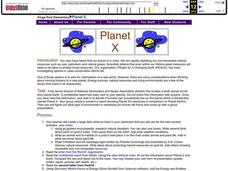
Planet X
Students select a wide variety of presentation methods to compare Planet X and Earth. Students share these with their classmates. Students select other methods to present their ideas about a livable planet for human life forms. ...
Curated OER
Heat Pollution and Communities
Students examine thermal pollution by collecting temperature data on the school's photovoltaic panel. Students collect data for four consecutive days and retrieve information from other classes that meet at different times of the day. ...
Curated OER
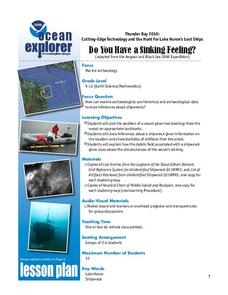
Do You Have a Sinking Feeling
Students determine how marine archaeologists use historical and archaeological data to draw inferences about shipwrecks. Students plot the position of a shipwrecked vessel, and draw inferences about the shipwreck from artifacts that have...
Curated OER
Turn It Upside Down: Introduction to Computer-Aided Design
High schoolers explore a computer-aided design program. Students chart out roller coaster design, computer graphics and architecture. High schoolers focus on understanding the connections between mathematics, science, technology and...
Curated OER
Deep Freeze
Students practice various sampling methods for retrieving data under water, ice, and soil. They use the sample material to make temperature measurements, chart contents, and draw their own conclusions as to what is happening in the...
Curated OER
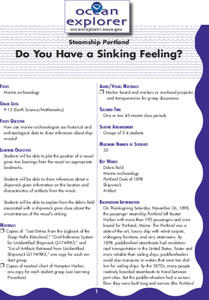
Do You Have a Sinking Feeling?
Young scholars explore how marine archaeologists use data to draw inferences about shipwrecks. In this marine archeology lesson students plot the position of a vessel, draw inferences about a shipwreck and explain the possible...
Curated OER
Chew on This
Eighth graders explore and demonstrate the seven steps of the scientific method. They predict how much sugar is in chewing gum and test, analyze, and calculate the sugar content of gum.
Curated OER
Ya' Gotta Have Heart
Fourth graders study the parts of the human circulatory system and how they function. They design a flow chart of the circulatory system and use data to construct charts and graphs.
Curated OER
Daily Weather Calendar
Third graders use the internet to record the daily weather conditions. Using symbols, they take the information they gathered and create an easy to read chart. They share their charts with the class to end the lesson.
Curated OER
Butterflies, Butterflies, Butterflies
Transform your class into a butterfly museum! Research different types of butterflies, their habitat, and life cycle. Interactive components such as PowerPoint presentations, Claymation movies, and webpages add pizzaz to the museum...
Project SMART
Rocks and Minerals: Touch the Earth
Students complete a unit of lessons on rocks and minerals. They conduct research, write e-mail questions to geologists, write daily journal entries, label maps demonstrating types of rocks/minerals found, and create a web page that...
Conserve Wildlife Foundation of New Jersey
The Great Peregrine Scavenger Hunt - On the Internet
The story of one bird provides valuable insight into general animal behaviors and interactions. Young researchers investigate the peregrine falcon using a web search. They analyze the behaviors of the raptor including its migration...
Curated OER
Local Weather And Location
Students explain how uneven heating of Earth affects wind and water currents. They describe the limits on current technology in predicting weather and how the Water Cycle is related to local weather.
Curated OER
Simple Machine Research
Fifth graders demonstrate the ability to use scientific skills and Processes to describe forces that act upon objects to cause specific changes in motion. They identify and describe a science problem related to forces and simple machines.
Curated OER
Do You Have A Sinking Feeling?
Students plot the positions of vessels given bearings in the form of landmarks. They explain how the debris field can help solve the mystery in how the ship sunk.
Curated OER
Comparing Amount of Rainfall in Different Geographical Areas
Learners construct rain gauges and use them to log rainfall in their school zone, local city, and region and then compare and discuss them by plotting this information.


