Curated OER
DRY UP BABY ! ANHYDROBIOSIS (freeze drying)
In this lab, students explore how organisms are able to survive the extreme environmental conditions found in the Polar regions. Students observe and draw active living rotifers and Tardigrades, design and perform experiments to collect...
Curated OER
Parched! No Water, No Town
Students discuss the benefits of water conservation. Given a data sheet, they document their water usage over a specified period. Water usage data is graphed and analyzed. Students discuss ways in which they can conserve water.
Curated OER
Fish Communities in the Hudson
Students use tables of fish collection data to draw conclusions about where fish live in the Hudson Estuary. Given available data they interpret organized observations and measurements and recognize simple patterns, sequences, and...
Curated OER
Graphing Favorite Colors
Third graders collect data and insert it into ClarisWorks to create a spreadsheet/graph of their favorite color. They interpret the data together.
Curated OER
Wings and Othe Things
Learners work in groups that are engaged in different activities at different times. They watch the video "Madagascar" and collect data pertaining to the Fish Eagle's arm spam. They work together to perform mathematical computations...
Curated OER
Drifting Continents, Dynamic Results
Students plot earthquake and volcano data using a Compass Rose Plotting. They explain the relationship between plate movement and connection. They draw conclusions that earthquakes and volcanoes occur in predictable locations.
Curated OER
It's Your Choice
Students compare data and determine the appropriate way to organize the data. They use physical graphs, pictographs, and symbolic graphs to display their data. In addition, they complete a Venn diagram.
Curated OER
Assessing Water Quality in a Local Creek by Sampling Aquatic Macroinvertabrets
Students experiment collecting macroinvertebrates from a stream and identify the specimens collected and then log in the information into a data table. From the data, they make qualitative and quantitative interpretations of water quality.
Curated OER
Tree Study
Students measure the lengths of provided leafs to the nearest millimeter. Students identify trends in the data as well as sourced of inaccuracy and formulate additional questions that could be investigated to enhance their understanding.
Curated OER
Timed Multiplication Test Graphs
Pupils use the tools of data analysis for managing information. They solve problems by generating, collecting, organizing, displaying histograms on bar graphs, circle graphs, line graphs, pictographs and charts. Students determine range,...
Curated OER
Life In Extreme Environments
Students work together to design and participate in experiments to determine the rate rotifers eat. After completing their experiments, they record and analyze their data and identify any challenges faced during the procedure. They...
Curated OER
Go West My Class
Students find data that can be mapped on the Factfinder Web page. They analyze the data from the web site and state recommendations on whether a person should live in Illinois or not based on their preferences.
Curated OER
Rainforest Deforestation and the Water Cycle
Young scholars create terrariums (mini rainforests). They observe and discuss the life processes that occur in their terrariums and how changes in these processes affect the plants and organisms inside. They collect and graph data and...
Curated OER
Thank You... Thomas Edison!
Learners investigate the life of Thomas Edison. They research how he made a difference. They understand that accurate data collection is important for math. They create a chart using spreadsheet data.
Curated OER
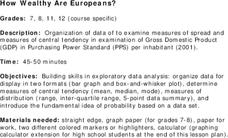
How Wealthy Are Europeans?
Students investigate measures of central tendency. They examine compiled data and conduct critical analysis. The graph is focusing on the gross domestic product data. The lesson also reviews the concept of putting values in order of...
Curated OER
Technology as a Tool of Science
Students monitor streams, take stream surveys, collect chemical and macro-invertebrate and stream discharge data. Using a digital camera, students observe the percentage of various types of vegetation on the flood plan, riparian area and...
Curated OER
1-4 Study Guide Integration: Statistics Stem-and-Leaf Plots
In this statistical worksheet, students organize given data into a stem-and-leaf plot. They then use their organize data to answer given questions. Students create two stem-and-leaf plots and answer five questions. An answer sheet is...
Curated OER
Working with Frequency Tables
For this Working with Frequency Tables worksheet, learners analyze data that is organized in simple frequency charts. They calculate average from data presented in a frequency table, calculate a cumulative score, and identify data that...
Curated OER
Marine Biology Lesson on Understanding the Dynamics of the Reef Ecosystem
Students compare data from a healty and unhealthy reef ecosystem. In this marine biology lesson, students identify which sample is stressed. They formulate a hypothesis on why the reef is stressed and support their hypothesis with proven...
Curated OER
Glacial Change
Students research the ways in which scientists study glaciers and glacial change. They interpret real time data and calculate the estimated global sea level rise potential. A very good activity to illustrate global warming.
Curated OER
Hatching Brine Shrimp
Third graders investigate the environment that is considered favorable for brine shrimp hatching. The salinity level is of particular interest in the observations because the optimum level is needed for survival. They make daily...
Curated OER
Lesson Plan for Fontana Mines
Students estimate and compute with rational numbers. They compare, order and convert among fractions, decimals and percents. Students analyze problems to determine if there is sufficient or extraneous data to solve.
Curated OER
On Our Way to School
First graders create a class graph that illustrates how they get to school and interpret data from the graph. They complete an assessment worksheet independently and answer questions about the graph shown.
Other popular searches
- Organizing Data
- Collect and Organize Data
- Collecting and Organizing Data
- Organizing and Graphing Data
- Organizing Data in Tables
- Organize Data
- Ways to Organize Data
- Organizing Data Using Tables
- Math Lessons Organizing Data
- 5th Grade Organizing Data
- Tally Chart Organize Data
- Gather and Organizing Data


