Code.org
Cleaning Data
"Clean the data!" "I did not know it was dirty." Introduce your class to the process of cleaning data so that it can analyze it. Groups work through a guide that demonstrates the common ways to filter and sort data. Pairs then...
Curated OER
Introduction to Representing and Analyzing Data
Represent data graphically. Allow your class to explore different methods of representing data. They create foldables, sing songs, and play a dice game to reinforce the measures of central tendency.
Illustrative Mathematics
Weather Graph Data
Teaching young mathematicians about collecting and analyzing data allows for a variety of fun and engaging activities. Here, children observe the weather every day for a month, recording their observations in the form of a bar graph....
Curated OER
Data Squares
Middle and high schoolers examine how data squares organize and sort information and data sets. They discuss examples of data squares, complete a data square about themselves, organize the data squares for the class together, and compile...
Curated OER
Monster Data
An inventive lesson shows learners how to collect, organize, and present mathematical data. They access websites which lead them through a variety of ways to engage in data collection. They get to design and create graphs, and present...
NASA
Exploring Data
Bring the sun to your class! Young scholars analyze actual solar wind data in the second instructional activity of a five-part series. Their analysis includes speed, temperature, and density data.
College Board
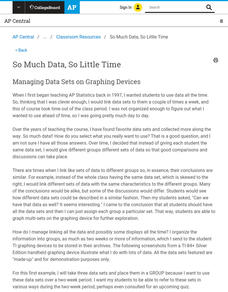
So Much Data, So Little Time
Organizing data in a statistics class is often a challenge. A veteran statistics teacher shares data organization tips in a lesson resource. The instructor shows how to group data to link to individual calculators in a more efficient...
Math Moves U
Collecting and Working with Data
Add to your collection of math resources with this extensive series of data analysis worksheets. Whether your teaching how to use frequency tables and tally charts to collect and organize data, or introducing young mathematicians to pie...
EngageNY
Summarizing Bivariate Categorical Data
How do you summarize data that cannot be averaged? Using an exploratory method, learners complete a two-way frequency table on super powers. The subject matter builds upon 8th grade knowledge of two-way tables.
Chicago Botanic Garden
Plant Phenology Data Analysis
Scientists monitor seasonal changes in plants to better understand their responses to climate change, in turn allowing them to make predictions regarding the future. The last activity in the series of six has scholars analyze BudBurst...
Curated OER
Many Ways to Represent Our Data
Demonstrate several ways to represent data with your class. They will use surveys to gather data and display the data using tally charts and graphs. Then answer questions according to the data.
Curated OER
Show Me The Data!
Pupils create a bar graph. They will collect and organize data to turn into bar graphs. They create graphs for the favorite sports of the class, color of M&M's, and types of cars passing by.
Chicago Botanic Garden
Plant Phenology Data Analysis
Beginning in 1851, Thoreau recorded the dates of the first spring blooms in Concord, and this data is helping scientists analyze climate change! The culminating instructional activity in the series of four has pupils graph and analyze...
Education Development Center
Creating Data Sets from Statistical Measures
Explore the measures of central tendency through a challenging task. Given values for the mean, median, mode, and range, collaborative groups create a set of data that would produce those values. They then critique other answers and...
Curated OER
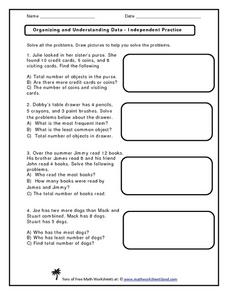
Organizing and Understanding Data - Independent Practice
Provide your first graders with an opportunity for independent practice organizing and understanding data. The ten story prompts on this three-page activity asks learners to solve problems involving concepts of the total number of...
Curriculum Corner
Data Binders
Here is a great resource to support students you have identified early on as needing behavioral or general learning support, particularly if you are practicing a Response to Intervention (RTI) approach. This data binder printable allows...
Curated OER
Describing Data
Your learners will practice many ways of describing data using coordinate algebra in this unit written to address many Common Core State Standards. Simple examples of different ways to organize data are shared and then practice problems...
Code.org
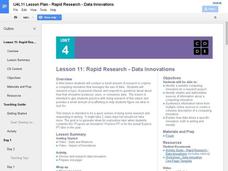
Rapid Research – Data Innovations
Scholars conduct research into a computing innovation of their choice and figure out how it uses data. They prepare brief reports of their research in the second installment of the series.
Curated OER
"Data Dabble"
Young scholars engage in a lesson which facilitates their use of web sites to find data, graph it, and interpret it, thus scaffolding graphing skills to prepare students for their 8th grade I-search exit project.
Curated OER
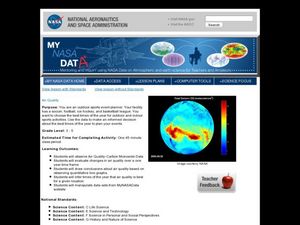
Air Quality
Students observe air quality and monoxide data. In this air quality lesson, students draw conclusions and manipulate data from a one year period on changes in air quality.
Curated OER
Tallies
Tally Marks are a wonderful way to keep track of data, and to foster counting for your young mathematicians. This resource has learners identify the correct number of tally marks for a given number. The numbers used are: 13, 15, 17, and...
Code.org
Identifying People with Data
How much information about you is out there? Scholars explore this question as they investigate data breaches and how these violations occur. They then take part in an activity where they research how easily people could get access to...
Teach Engineering
Where Are the Plastics Near Me? (Mapping the Data)
The last activity in a nine-part series has teams create a Google Earth map using the data they collected during a field trip. Using the map, groups analyze the results and make adjustments to the map to reflect their analysis. A short...
Curated OER
Student Costs Data Table
Students compare and contrast two routes selected for a virtual field trip. They create a data table of educational activities, lodging, and meal costs using Microsoft Excel software.
Other popular searches
- Organizing Data
- Collect and Organize Data
- Collecting and Organizing Data
- Organizing and Graphing Data
- Organizing Data in Tables
- Organize Data
- Ways to Organize Data
- Organizing Data Using Tables
- Math Lessons Organizing Data
- 5th Grade Organizing Data
- Tally Chart Organize Data
- Gather and Organizing Data


