Curated OER
Collecting and Organizing Data
Fifth graders explore methods of generating and organizing data. Afterward, they visit a specified website where they analyze data, organize, and create graphs. Students follow instructions and complete answers to questions. They...
Curated OER
Applied Science - Science and Math Pre-Lab 4C
Scholars classify the sciences. Using applied science, they compare and contrast subfields of sciences. They compare qualitative versus quatitative. They discuss types of sciences and the meanings of the word roots of the names.
Curated OER
How to Graph in Excel
Fourth graders construct data graphs on the Microsoft Excel program. In this statistics lesson, 4th graders formulate questions and collect data. Students represent their results by using Excel.
EngageNY
Using Matrix Operations for Encryption
Data encryption is an important security measure for sensitive data stored on computers. Pupils learn how to utilize matrices for creating code. They also get a great review of matrix multiplication, inverse matrices, and the identity...
Curated OER
When the Snow is as High as an Elephant
High schoolers study the concept of mean values using a data plot. Learners enter the given data in the activity to create their data table. They use the data table to calculate the mean of the snowfall percentage provided in the...
Curated OER
The Trash We Pass
Where does our garbage go? What is the difference between a recyclable and non-recyclable item? Pose these important, but often overlooked, questions to your class and invite them to consider the lasting and damaging effects of the...
Curated OER
Which Coin?
Manage your money with change purses and piggy banks. Once they match different coins to corresponding price tags, first and second graders add the amounts of change in each illustration. For extra practice, bring in small items for kids...
Curated OER
How do We Treat Our Environment?
Seventh graders explore the concept of collecting data. In this data collection lesson, 7th graders survey others about their environmental habits. Students graph their data.
Discovery Education
Mood Music!
Grouchy? Sad? Here's a great resource that shows kids how music can be used to lift their spirits. Kids collect and chart data on the effects of music on emotions. After analyzing the results of their experiment, they develop their own...
Curated OER
Murder in the First Degree - The Death of Mr. Spud
Secondary learners investigate exponential functions in a real-world scenario. They collect data on the temperature of a cooling baked potato, enter the data into lists, and graph the data using a scatter plot before finding an...
Curated OER
Spaghetti Bridges
Eighth graders experiment with building bridges of spaghetti, pennies, and a cup to determine how varying the number of spagetti pieces affects the strength of the bridge. They graph their results and interpret the data.
Curated OER
Snack Attack
Learners design charts, tables, graphs, and pictographs to analyse the types of snacks in a bag.
Curated OER
It's My Time!
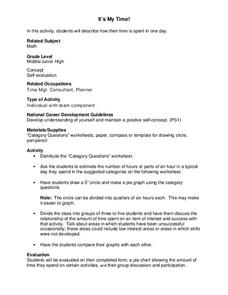
Students create a pie chart. In this time lesson, students determine the amount of time they spend on given activities. They create a pie chart diagraming the data. Students share their graphs with the class.
Curated OER
Pet Shop Decision
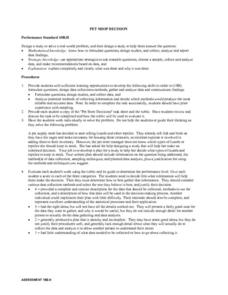
Students are given the "Pet Store Decisions" task sheet and a rubric that goes with it. Students discuss the task and make a plan for using the rubric sheet to complete the task. Students formulate questions, studies and data collection...
Curated OER
Rules of the Roll
Students roll a ball down a plank and measure the distance it travels. Students graph the distances the ball travels as they change the height of the incline (increase slope).
Curated OER
Nutrition and Food Security
Examine the three basic nutrients and their effects on the body. Fifth graders will research data to construct a bar graph and then demonstrate the relationship between malnutrition and food security. This is a very comprehensive...
Curated OER
Excel for Beginners
For this Excel lesson, students set a formula to check their homework. Students also use clipart, work in groups, and learn to use the tools in the drop-down list.
Curated OER
McCadam's Quarterly Report
Fourth graders problem solve a problem from a local business using data, generating graphs, and draw conclusions. They submit their findings in a business letter format with feed back from a company's plant manager.
Curated OER
Tourism in London
Students discuss the tourist attractions that are in London. They examine how data can be manipulated by completing a worksheet. They plan a trip to a London attraction after conducting Internet research.
PricewaterhouseCoopers
Risk Management and Insurance: Insurance Costs and Considerations
Compare the different types of insurance with high schoolers, and have them learn the benefits and costs of medical, auto, and home policies. The resource addresses what makes some insurances more costly and what teenagers can do to find...
Kenan Fellows
Lego Thinking and Building
Run a simulated airplane manufacturing plant with your pupils as the builders! Learners build Lego airplane models and collect data on the rate of production, comparing the number produced to the number defective. Using linear...
Curated OER
Ice Cream
Students explore the concepts of mean, median, mode, and range as they elicit data about people's favorite flavor of ice cream. A practical application of the data obtained offers an extension to the lesson plan.
Curated OER
Discovering Pi
Define terminology related to a circle. Practice accuracy in measuring and then create a spreadsheet based on data collected from solving for parts of a circle. Groups can have fun analyzing their data as it relates to Pi.
EngageNY
Sampling Variability and the Effect of Sample Size
The 19th installment in a 25-part series builds upon the sampling from the previous unit and takes a larger sample. Pupils compare the dot plots of sample means using two different sample sizes to find which one has the better variability.
Other popular searches
- Measurement Data Management
- Data Management Story
- Math and Data Management
- Math Lesson Data Management
- Data Management and Graphing
- Data Management Computing
- Data Management Analysis
- Data Management Math
- Data Management Lesson Plan
- Data Management Math Lessons
- Data Base Management Systems
- Business Data Management


