Curated OER
Pictures of Data
In this data worksheet, students look at maps and charts and answer multiple choice questions about them. Students complete 10 questions.
Statistics Education Web
Population Parameter with M-and-M's
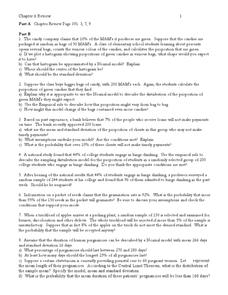
Manufacturers' claims may or may not be accurate, so proceed with caution. Here pupils use statistics to investigate the M&M's company's claim about the percentage of each color of candy in their packaging. Through the activity,...
Curated OER
Random Probability
For this statistics and probability worksheet, young statisticians solve and complete 13 different problems related to probability, percentages, and normal distributions. They consider data models, assumptions about the models, and find...
Firelands Local Schools
Exponential Growth and Decay
How can you safely model exponential growth and decay? A hands-on activity uses candies to model not only exponential decay, but also exponential growth. Exponential equations are fitted by hand and by use of a calculator...
Curated OER
Colors Samples
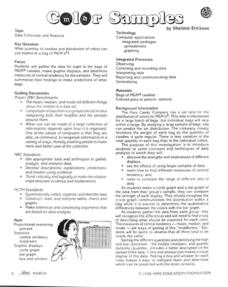
In this math worksheet, students take the time to count out the colors of the candies. They graph the results and make inferences from the information.
Texas State Energy Conservation Office
Investigation: Building a Parabolic-Trough Collector
Amateurs of alternative energy build a mini parabolic-trough solar energy collector and use it to heat water. Temperature is recorded over a three-minute period and the data is graphed and analyzed. Note that in order to paint aquarium...
Curated OER
Math, Sweet Math Activity Sheet
In this candy graphing learning exercise, 1st graders will place candy on their paper to create a bar graph. They will answer several questions based on their data. A teacher checklist is provided.
Curated OER
A Tasty Solution
In this solutions worksheet, students complete a three step procedure and record the dissolving time of candy. Using their data they create a graph and answer 4 analysis questions.
Curated OER
Smarties Investigation
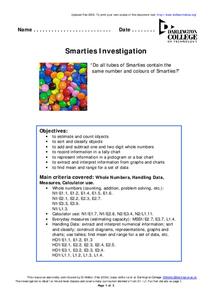
In this math worksheet, students complete a variety of activities using Smarties candy. For example, students estimate the number of each color, count the actual amount, and record their results in a tally chart.
Curated OER
M&M’s Math Worksheet
Who knew you could cover prediction, histograms, fractions, decimals, data collection, and averages (mean, median, and mode) all with a bag of M&M's®? Here's a fantastic set of worksheets to help you make candy a mathematical journey...
Curated OER
M&M Science and Math
A series of math and science activities feature M&M's® as manipulatives to help kids work through equations. The resource includes exercises on finding averages, percent of compositions, moles in chemical reactions, genotypes and...
Curated OER
Smarties Investigation
In this math worksheet, learners participate in an investigation of Smarties candy. For example, students estimate how many candies they have in each color, count the actual number, and record the information in a tally chart.


