EngageNY
Bean Counting
Why do I have to do bean counting if I'm not going to become an accountant? The 24th installment of a 35-part module has the class conducting experiments using beans to collect data. Learners use exponential functions to model this...
Curated OER
Analyzing Tree Rings to Determine Climate Change
Middle schoolers examine how to locate and access data sets. For this climate change lesson students import data into Excel and graph it.
National Security Agency
Going Green with Graphs
In this unit designed for second graders, youngsters are introduced to conducting surveys and creating tally charts based on the data they gather. Students then construct bar graphs, and observe the relationships between the two...
Curated OER
Courtship and Marriage
Students research the concept of courtship and marriage as it pertains to early New England and explore the values and culture that shaped our history. In this courtship and marriage lesson plan, students examine primary source documents...
Curated OER
Math of the Path: Students Calculate Data from the Lewis and Clark Journey
Students use calculations to complete the same journey of Lewis and Clark. They answer questions along their way and share information they gather with the class. They compare their calculations with those made by Lewis and Clark.
Curated OER
The Shape of Things
Sixth graders read and discuss information regarding the shape and attributes of an eggshell. In this shape of things lesson, 6th graders gather relevant information that pertains to the incubation and formation of an eggshell. ...
Curated OER
Data From Interviews
Students create and conduct a survey about favorite foods, gather and represent the data, interpret data and make predictions to present to the class. They create and use interview questions to gather data. Pupils are explained that...
Curated OER
Introduction to Graphs
Learners poll classmates to gather information for a graph. They identify three types of graphs (bar, line, table). Students create each type of graph using data gathered from classmates.
National Museum of Nuclear Science & History
Nuclear Popcorn
Make your lesson on radioactive decay pop with this lab exercise. Using popcorn kernels spread over a tabletop, participants pick up all of those that point toward the back of the room, that is, those that represent decayed atoms. As the...
Curated OER
Sink or Float
Third graders sort objects into those they think will float and those that will sink and test their predictions. They experiment with clay molding it into shapes that float. They place pennies in them until they sink. They test other...
Math Worksheets Land
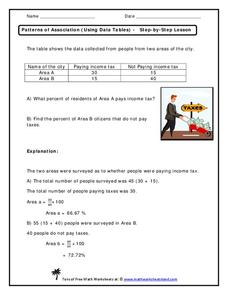
Patterns of Association (Using Data Tables) - Step-by-Step Lesson
This worksheet belongs to a four-part resource that gathers information from data tables to calculate percentages. The page introduces one problem and shares an explanation to the answer.
Curated OER
Asthma Survey
Young scholars collect survey data on the prevalence of asthma in a community. They summarize and display the survey data in ways that show meaning.
Curated OER
Numbers Tell a Story
Students connect census data to historical events. In this civics lesson plan, students understand cause and effect, and how they are reflected in census data and analyze census data for social and economic significance.
Curated OER
Charts and Graphs
Fifth graders interpret data into graphs and percentages. In this organizing data lesson, 5th graders discuss bar, circle and line graphs. Students complete bar graph and apply probability using the results.
Curated OER
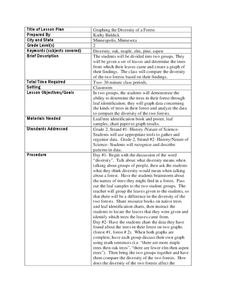
Graphing the Diversity of a Forest
Second graders work in groups to identify what types of trees create which types of leaves In this plant life lesson plan, 2nd graders analyze a set of leaves and identify the tree it came from while graphing the data in a science...
Curated OER
Arthur Young and the President
Students work with NASS data by converting it into prose. In this historical agriculture information lesson, students read about how George Washington communicated information about crop yields, livestock, and land values. They apply the...
Curated OER
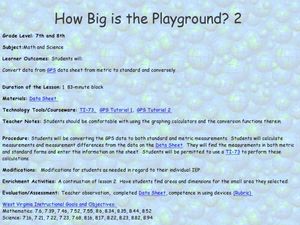
How Big Is The Playground?
Students calculate the standard and metric measurements of a playground. In this measurement instructional activity, students use GPS coordinates and graphing calculators to determine the dimensions of an area outside of the school in...
Curated OER
Solar Cell Energy Availability From Around the Country
Students determine areas that are the most likely to produce solar energy by using NASA data. In this solar energy lesson students analyze plots and determine solar panel use.
It's About Time
Taking a Ride on a Lithospheric Plate
Assist your pupils and broaden their horizons with several activities that determine the exact positioning of various communities over the globe. Pupils use data from the Global Positioning System to determine the position and rate of...
Institute for Humane Education
I've Been Branded!
How many pairs of Nikes® or Apple® products are in the average American home? What makes someone buy one particular type of laundry detergent over another? Scholars grapple with these questions as they develop a list of brands they use...
Virginia Department of Education
Electricity and Magnetism
Take charge of your class and provide them with an electrical experience! Individuals investigate the basic principles of electricity and magnetism by creating a model to test electric current and the amount of electricity generated....
Curated OER
Dear George Using Census Data
Sixth graders discuss differences in the way in which information was disseminated in George Washington's time and how it is acquired in contemporary times. They examine Census of Agriculture data and a modern day version of a letter...
Curated OER
Society, Cyberspace and the Future
Young scholars locate information on the rapid growth of world population and consumption needs through the use of Internet, Cd-ROMs, laser dics and other media. They use spreadsheet to present data gathered on world population growth...
Curated OER
M & M Madness
Students work with the mathematics unit of collection, organization, and presentation of data. In this math and technology lesson plan, students use Valentine M & M’s and The Graph Club to sort and graph the various colored M & M’s.
Other popular searches
- Science Data Gathering
- Gathering and Graphing Data
- Data Gathering Strategies
- Gathering Qualitative Data
- Data Gathering Tests
- Gathering and Charting Data
- Math Data Gathering
- Math, Data Gathering
- Gathering Weather Data
- Data Gathering and Analysis
- Errors in Data Gathering
- Data Gathering Accuracy


