Curated OER
Did Voters Turn Out -- or Are They Turned Off?
What was the voter turnout at your last state election? Examine voter turnout statistics from the most recent election to learn which ten states have the best turnout record. This lesson offers election data, handouts, and worksheets.
Code.org
Check Your Assumptions
Always check your assumptions when interpreting data and data visualizations. That's the take away from this exercise. Class members examine a failed project that looks at search trends to predict flu outbreaks and consider the...
Curated OER
Identifying Ozone Variations over Different Locations
Students analyze ozone data. In this atmosphere lesson, students will use a NASA resource to gather data for different regions of the Earth. Students will then create a graph for their data and answer related questions.
Curated OER
Capacitors: What Are They?
Students discover how capacitors help store data. In this computer science lesson, students investigate how capacitors can store an electronic charge, eventually helping computers store data. Students create their own...
Curated OER
Fish and Zooplankton Through Remote Sensing
Ecology aces examine sea surface temperature maps and relate temperatures to concentration in fish and zooplankton populations. Take your class to a computer lab and provide experience with actual remote sensing data. Some of the links...
Teach Engineering
Accelerometer: Centripetal Acceleration
Scholars build robotic arms that swing back and forth and use them to collect velocity and acceleration data. To analyze the results, pupils compare data to the equations for angular velocity and centripetal acceleration.
Computer Science Unplugged
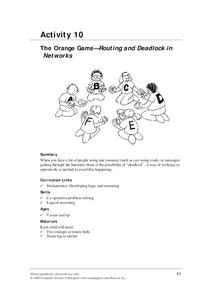
The Orange Game–Routing and Deadlock in Networks
How is data able to move in a congested network? Groups simulate moving data around a congested network by passing fruit around a circle, following specific rules, until everyone ends up with their own fruit. Extension activities...
Teach Engineering
Complex Networks and Graphs
Show your class how engineers use graphs to understand large and complex systems. The resource provides the beginnings of graph theory by introducing the class to set theory, graphs, and degree distributions of a graph.
Teach Engineering
Start Networking!
Class members create their own social networks by collecting signatures before graphing the interactions with their fellow classmates. The degree distribution of the simulated social network is determined by calculating the degree of...
Rochester Institute of Technology
Hazmat Disposal
What a waste! The last installment of a nine-part technology/engineering series teaches learners about medical waste disposal systems. Conducting a simulation allows individuals to understand how monetary considerations constrain waste...
Rochester Institue of Technology
Meal Picking
Scholars explore systems design and its relation to meal picking by using computer simulations to test systems designs. They learn about the Pick-to-Light System and calculate average picking times.
Curated OER
Electronic Components
Students review new terminology and computer circuits and the value of a resistor. They complete three experiments, "Resistance Activities," Transistor Activities,"Diode Activities" and enter data, results and their findings on Student...
Curated OER
Is the Hudson River Too Salty to Drink?
Students explore reasons for varied salinity in bodies of water. In this geographical inquiry lesson, students use a variety of visual and written information including maps, data tables, and graphs, to form a hypothesis as to why the...
Curated OER
TE Activity: Super Spinners!
Students make spinners to investigate rotational inertia, rotational speed, angular momentum, and velocity. They make two sets of spinners that have different mass distributions and shapes. They complete a worksheet while experimenting...
Curated OER
Food Web in the Bay
Sixth graders study the food web in a bay. In this food web lesson plan, 6th graders investigate the SAV- submerged aquatic vegetation of a bay including their predators, and how the organisms eat, have proper living space and water....
Curated OER
Smarty Pants
Learners graph the colour distribution found in a packet of Skittle lollies, M&M's, Smarties or similar sweets. Results are compared and recorded against the results of other class members.
Curated OER
Science Lab Safety Procedures
Eighth graders watch a Lab Safety video and discuss particular questions related to lab safety. Lab equipment is then distributed and the students inspect the equipment and record their finding in their journal. Finally, in groups, 8th...
Curated OER
Literal Equations
Students explore Literal Equations. In this literal equations lesson, students use the Internet to connect to links and solve linear equations. Students investigate, analyze and record their findings on various activity worksheets.
Virginia Department of Education
Researching Information
Give your junior high researchers a clear concept of how to go about starting their research paper with the resources available in this exercise. Learners develop an idea to research, and spend time in the library or computer lab...
NASA
Soda Straw Rockets
Three, two, one, blast off to a better understanding of force and motion with this exciting science lesson! Beginning with a discussion about rockets and gravity, young scientists go on to complete a series of worksheets about net...
Alabama Learning Exchange
How Old Is That Tree?
Fifth graders study environmental changes by examining the annual rings of a cross-section of a tree trunk. They access websites to complete a worksheet on the parts of a tree. They count the annual rings on a tree slice while observing...
Curated OER
The Five Life Zone Research Project
Students study five of the seven life zones in North America. In this journalism lesson students use the Scientific Method working in teams. They use lab equipment and technology to create a presentation on five of the seven life zones...
Curated OER
The World is a Village
Students observe Americans through the eyes of the world. In this human population lesson plan, students utilize the Internet to view the World Pop Clock and follow the world's population by the minute. Students predict what...
Curated OER
Breaking News English: One Hundred Dollar Laptop Computer
In this one hundred dollar laptop computer instructional activity, students read the article, answer true and false questions, complete synonym matching, complete phrase matching, complete a gap fill, answer short answer questions,...


