K12 Reader
Displaying Data
It's important to learn how to display data to make the information easier for people to understand. A reading activity prompts kids to use context clues to answer five comprehension questions after reading several paragraphs about...
Curated OER
The Gathering and Analysis of Data
Young mathematicians gather data on a topic, graph it in various forms, interpret the information, and write a summary of the data. They present their data and graphs to the class.
Curated OER
Shaky New Zealand
Students explore geography by answering study questions in class. In this plate tectonics lesson, students identify the earthquake data concerning the country of New Zealand and answer questions regarding the data. Students identify...
Curated OER
Data Analysis and Data Explorer
Students use the Data Explorer software to organize and display the test scores for the classes in stacked box-and-whisker plots, then analyze the results in paragraph form.
Curated OER
Bell Curve
Students explore averages by completing a data analysis activity. In this bell curve lesson, students measure different food items and plot their measurements on a X and Y axis. Students create bell curves around the average weight or...
Curated OER
Ramp Builder
Learners plan and build a ramp designed for maximum distance a car can travel. In this physics and data collection math lesson, students work in groups to design a ramp using various household materials. Learners test small cars on their...
Curated OER
Misleading Graphs
Students explore number relationships by participating in a data collection activity. In this statistics lesson, students participate in a role-play activitiy in which they own a scrap material storefront that must replenish its...
Pennsylvania Department of Education
Use Order of Operations to Evaluate Expressions—No Grouping Symbols
Students identify and explain different types of data collection and graphs. In this graphs and data collection instructional activity, students record their observations of a variety of data collection tools and graphs displayed in the...
Curated OER
Discovering Magnets and Graphs
Sixth graders investigate averages and statistics by discovering magnet strengths. In this magnet experiment lesson, 6th graders utilize different magnets and attempt to attract different materials to them. Students record...
Curated OER
Central Tendencies and Normal Distribution Curve
Fourth graders are given data (class test scores) to determine central tendencies, and find information needed to construct a normal distribution curve. They become proficient in calculating mode, median and average.
Curated OER
The People of Kansas: Where did they come from and why did they come?
Students review census data to correlate to emigration in Kansas. For this Westward Expansion lesson, students analyze a painting and create definitions for emigration and discuss why people emigrate. Students read and analyze 1855...
Curated OER
Arthur Young and the President
Students work with NASS data by converting it into prose. In this historical agriculture information lesson, students read about how George Washington communicated information about crop yields, livestock, and land values. They apply the...
Curated OER
Dear George Using Census Data
Sixth graders discuss differences in the way in which information was disseminated in George Washington's time and how it is acquired in contemporary times. They examine Census of Agriculture data and a modern day version of a letter...
Curated OER
Virtual Field Trip: Lesson Ten - Publishing
Class members publish a letter describing their Virtual Field Trip incorporating data from previously developed charts, graphs, and data tables. The final lesson in a series devoted to collecting information and publishing data.
Core Knowledge Foundation
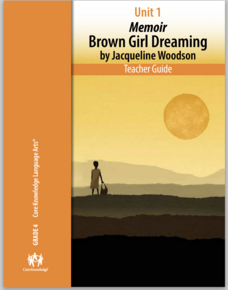
Unit 1: Memoir - Brown Girl Dreaming by Jacqueline Woodson
The memoir, Brown Girl Dreaming by Jacqueline Woodson, is the focus of a unit designed for fourth graders. Scholars begin each lesson with a warm-up, then listen to a read-aloud of a section of the book. Pupils complete word work,...
Curated OER
Create a Public Opinion Survey: The Middle East in the News
Though the discrete content here is a pair of New York Times articles about a 1998 military strike on Iraq and the coincident impeachment by the House of Representatives of then-President Clinton, this detailed plan for creating,...
Curated OER
Favorite Survey
Fourth graders collect and organize data for charts and bar graphs by questioning their classmates. They utilize a worksheet imbedded in this plan which guides them through their 'favorites' survey.
Curated OER
How Diverse is That?
Compare various types of biological diversity in a coral reef and calculate a numeric indicator that describes the diversity found in coral communities. Your class can work in groups to look at the abundance and distribution data of...
Curated OER
A PICTURE IS WORTH A THOUSAND WORDS
Students compare and contrast characters from various texts and compile the collected data into several graphic organizers.
Curated OER
Linguistic Diversity. Languages in Canada - Elementary
Create a language mosaic to reveal the linguistic diversity in your community. Pupils interview a person with a home language other than English and contribute to a bulletin board display representing the variety of languages spoken. The...
Curated OER
When Dinosaurs Ruled the World
Students graph the varying sizes of dinosaurs. In this math and dinosaur lesson, students view dinosaur models and compare the different shapes and sizes of the dinosaurs. Students complete a dinosaur math activity, read The...
Curated OER
Facts on Fish Species
Here is a brief outline of facts on various Chesapeake Bay fish species. Use it as an example of what kind of information you want your life science learners to collect when you assign them a specific species to research. Another way to...
Curated OER
Examing the San Francisco Earthquake
Students analyze photographic data about the San Francisco earthquake for evidence of its cause and effect. they determine if damage was caused by the earthquake itself or the ensuing fire. They role-play as earthquake survivors and...
EngageNY
TASC Transition Curriculum: Workshop 9
Here's a workshop for teachers that rocks the academic world! Using earthquakes as a medium for instruction, educators learn about crosscutting engineering with science. Fun, hands-on, collaborative exercises encourage participants to...


