Curated OER
Box and Whiskers
Middle schoolers discover how to relate collected data with a box and whiskers graph in a number of formats. They collect, organize, create, and interpret a box and whiskers graph. Pupils interpret the difference between sets of data,...
Curated OER
Counting on Cup
A basic approach to counting on, this math game has beginners partner up and use number cards and dice as they practice beginning addition. One partner chooses a number card and counts that many objects into a cup. The second partner...
American Statistical Association
Candy Judging
Determine the class favorite. The statistics lesson plan has pupils collect, display, and analyze data. Pairs rank four kinds of candy based on their individual preferences. Working as an entire class, learners determine a way to display...
Curated OER
Ketchup to Collecting Data
First graders collect data for a survey of 3 brands of ketchup and create class charts. They taste test three different brands of ketchup, and use the data to create a presentation. Tasty lesson!
Curated OER
Behavior tracking sheet
Here is a template for tracking and recording an expected behavior. For use with an Autistic pupil working on verbal communication skills, this sheet provides a way to track the number of times and prompts needed for the him to ask for...
National Wildlife Federation
Get Your Techno On
Desert regions are hotter for multiple reasons; the lack of vegetation causes the sun's heat to go straight into the surface and the lack of moisture means none of the heat is being transferred into evaporation. This concept, and other...
Curated OER
Moon Watch: Observing the Lunar Phases with a Model
How do you know the moon is going broke? It's down to its last quarter. The lesson provides a more accurate way to teach lunar phases, emphasizing not only naming or understanding them, but being able to explain why they occur....
Chicago Botanic Garden
Preparing for Project BudBurst
Plants take cues from the environment—change in daylight hours and temperature—to complete their seasonal life cycles. Lesson four in the series of six has classes collect phenology data on plants. After taking initial observations,...
Curated OER
What's Up With My Class
Middle schoolers collect data about their class and they use Excel spreadsheet to display their tables and graphs about the class. They answer survey questions and collect their data. Students create a graph of their choice to display...
Curated OER
"Lucky Charms": Interpreting Data and Making Predictions
Seventh graders determine if a "lucky charm" will increase their chances of winning a game. Students calculate the experimental probability of each player in a game. They observe and collect data from each activity. Students compare the...
American Statistical Association
How Long is 30 Seconds?
Is time on your side? Pupils come up with an experiment to test whether their classmates can guess how long it takes for 30 seconds to elapse. They divide the class data into two groups, create box-and-whisker plots, and analyze the...
Curated OER
Mystery Jars
This is a twist on the old "guess how many jellybeans" game. Using estimation and math skills, learners participate in a fun "mystery jars" activity, trying to make educated guesses at how many objects are in two jars. The basic activity...
Curated OER
Close Observation: Coins
Integrate math, science, and speaking/listening with a collaborative hands-on activity. Each group works with a single penny, examining it with the naked eye and recording observations. Repeat using magnifying glasses. Then repeat with a...
Curated OER
Less and More Scavenger Hunt
Send your scholars on a measuring scavenger hunt with this interactive learning exercise! They use a graphic organizer to record their findings as they search for items which are less than, more than, or just about one inch long. For...
NASA
Launch Altitude Tracker
Using PVC pipe and aquarium tubing, build an altitude tracker. Pupils then use the altitude tracker, along with a tangent table, to calculate the altitude of a launched rocket using the included data collection sheet.
Curated OER
Wiggle Worms
First graders investigate worms, collect and analyze data. In this worm and data lesson, 1st graders listen to Chick and Duckling from the Macmillan/McGraw-Hill reading series. They conduct experiments with worms, collect simple data,...
Curated OER
Uninsured in America
Students explore the issue of being uninsured in America. In this social issues lesson, students review data about uninsured Americans. Students create and conduct surveys related to the social issue of being uninsured.
American Statistical Association
Don't Spill the Beans!
Become a bean counter. Pupils use a fun activity to design and execute an experiment to determine whether they can grab more beans with their dominant hand or non-dominant hand. They use the class data to create scatter plots and then...
National Security Agency
Starting a Restaurant
Through an engaging unit, chefs-in-training will sort and classify data using tally charts. Learners will also create bar graphs to display restaurant data and interpret data from bar graphs using a variety of categories. This is a fun...
Curated OER
Collecting Data to Learn About the People Around You
Human graphs, anyone? Did you eat fruit today? What is your favorite costume? Have your K – 6 learners graph the responses. Early elementary grades may count and compare while upper grades compare responses of different groups or make...
University of Georgia
Would Your Cat Eat This Stuff?
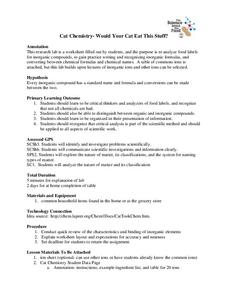
Processed foods use inorganic compounds for flavoring and preservation. This take-home laboratory challenges scholars to find 20 different compounds identified on the labels of foods to list on their data collection sheet. The activity...
Curated OER
Do Not Open Until May 2000!
Students create a time capsule. In this time capsule lesson, students collect and record data about themselves to be stored in a time capsule that will be opened at the end of the year.
Curated OER
Surveys and Samples
For this surveys and samples worksheet, students discover data collection techniques and write their own survey questions. Students use random sampling, convenience sampling, and systemic sampling and analyze their results.
Curated OER
Numbers and Me
Students collect and graph data about themselves. In this collecting and graphing data lesson, students poll their classmates about how many siblings they have or they measure their height. Students make a bar graph of their data. ...


