Teach Engineering
Statistical Analysis of Flexible Circuits
Scholars connect statistical analysis with flexible electric circuits. They first learn about flexible circuits and their applications through a PowerPoint presentation and then consider how the fabrication process for these circuits...
Curated OER
Data and Scientific Graphs
Students conduct experiments and graph their data. In this statistics lesson, students collect data and graph it on a coordinate plane. They analyze the data looking for patterns and they discuss their findings with the class.
Curated OER
Organizing Data
In this statistics worksheet, 11th graders collect data and organize it using a frequency table. They plot their data and analyze it using stem and leaf plots. There are 3 questions with an answer key.
Flipped Math
Unit 4 Review: One Variable Statistics
It's always nice to slow down and review. Scholars work on problems covering concepts on one-variable statistics. They create and interpret box plots and stem-and-leaf plots, determine the mean, median, mode, interquartile range, and...
College Board
AP® Psychology: Teaching Statistics and Research Methodology
Psychologists use statistics? Scholars investigate the research behind the methodology of statistical analysis. Using hands-on practice, case-studies, and scatterplots, they complete various tasks to understand the very roots of high...
Shmoop
Box, Stem-Leaf, and Histogram
A helpful and versatile activity requires young mathematicians to analyze data in order to create graphs and answer questions. Additionally, it prompts learners to find the mean, median, mode, and range of some of the data sets.
Curated OER
Integration: Statistics, Measures of Central Tendency
Learners find the mean, median, and mode for each of four data sets. They are given two line plots, and compute the median and mode of the shown data. They find the median and mode for three stem and leaf plots. They solve two word...
Curated OER
Comparing Temperatures and Latitudes
Eighth graders collect weather data from a variety of cities at the same latitudes, but on different continents. They organize data using spreadsheet program, generate graphs, and incorporate into a word processing document. Students...
EngageNY
Mid-Module Assessment Task - Algebra 1 (module 2)
A mid-module assessment uses two multi-part questions to measure progress toward mastery on descriptive statistics standards. Each part of a question addresses a single standard to help determine mastery.
British Council
Chocolate
Are you the biggest chocoholic? Scholars read text about people eating chocolate and sequence the text by putting them in order of who ate the most to least chocolate. They quiz classmates to discover who is the biggest chocoholic in the...
Curated OER
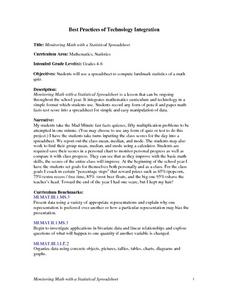
Monitoring Math with a Statistical Spreadsheet
Learners use a spreadsheet to compute landmark statistics of a math
quiz. This instructional activity can be ongoing throughout the school year and it integrates mathematics curriculum and technology in a simple format for student use.
Curated OER
High Exposure
Students interpret data they receive from the media, discuss possible misinterpretation of data from the media and correctly respond to the misconception quiz question.
Curated OER
Research Methods in Psychology
This 5-question psychology review provided by Sparknotes addresses sampling bias, correlative data, statistical significance, and more.
Curated OER
The Histogram
In this Algebra I/Algebra II instructional activity, students construct and analyze histograms to develop a visual impression of the distributions of data. The two page instructional activity contains five problems. Answer key is...
Curated OER
Line of Best Fit
Students identify the line of best fit. In this statistics lesson, students collect and analyze data. They calculate the regression equations and identify the different types of correlation.
Curated OER
Creating Frequency Tables
For this frequency table worksheet, students explore a given set of numbers. They group the data and create a frequency table. This one-page worksheet contains ten problems.
Curated OER
Measures of Central Tendency
In this measures of central tendency worksheet, learners find the mean, median, and mode of 9 problems given different data sets. Students then solve 2 word problems.
Curated OER
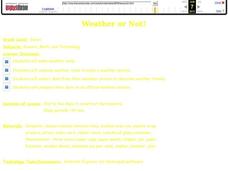
Weather or Not!
Seventh graders discuss weather. In this meteorology lesson, 7th graders view a movie on weather and take a quiz. They work in groups to make weather tools for a class weather station.
Curated OER
"Who Am I?" - Quiz #2
In this "Who Am I?" quiz worksheet, students examine the 12 clues regarding noteworthy scientists born between 1452 and 1951. Students identify the scientists and click on links to check their answers.
Curated OER
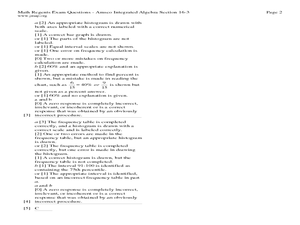
Math Regents Exam Questions - Pearson Integrated Algebra P.304: Histograms
In this histograms worksheet, students solve 9 short answer, multiple choice, and graphing problems. Students construct frequency tables and histograms of data.
Curated OER
Memorial Day: Graphing Our History of Sacrifice
Students examine the significance of Memorial Day. They analyze data, conduct Internet research, create a graph using an online graphing tool, and take a quiz.
Noyce Foundation
Time to Get Clean
It's assessment time! Determine your young mathematicians' understanding of elapsed time with this brief, five-question quiz.
Curated OER
The Ultimate Sacrifice
Students explore the concept of sacrifice during wartime. In this World War II instructional activity, students explore the Allied and Axis Powers that existed during the war. Students discover sacrifices that were made by both powers...
Curated OER
Calcium Counts
Students evaluate the food pyramid. In this dairy nutrition lesson plan, students identify the position of the milk group on the food pyramid, then determine their daily calcium requirement and how they can meet that requirement.


