Curated OER
Creating a Spreadsheet and Graph
Students create graphs in Excel. In this spreadsheet lesson, students input data into spreadsheet cells then use the graphing feature of the Excel program to produce colorful graphs of the data. The directions to create the graph are...
Curated OER
Mean, Median, Mode, and Range
Fifth graders determine the meaning of mean, median, mode, and range. In this measures of central tendency lesson, 5th graders show their ability to find the mean, median, range, and mode of a data set. They use a class set of birthday...
Curated OER
Populations and Life Cycles
Students explore biology by researching ocean statistics. For this data analysis lesson, students conduct a snail examination experiment utilizing live pouch snails. Students collect data about the snails over the course of six weeks and...
Curated OER
Graphing the Weather
Fourth graders predict the weather for their area using simple weather instruments. They take readings for a month during a season and graph their results. Students describe weather patterns based on their data and predict future weather...
Curated OER
Choose a Path
In this addition worksheet, students utilize data from a map to answer 6 fill in the blank questions where they provide the missing addends to addition problems.
Curated OER
Leveled Problem Solving: Choosing and Analyzing Data Displays
In this using a bar graph to solve word problems worksheet, students choose and analyze data to problem solve. Students solve six problems.
Curated OER
Data Handling: Sorting Shapes
In this recording data and shape sorting worksheet, learners color a chart to show how many green cubes and yellow cylinders are shown. They color the correct number of each shape.
Curated OER
Microsoft Office Excel
Middle schoolers use Microsoft Office Excel. In this technology lesson, students enter data on a spreadsheet using Excel. This programs tallies data and presents it using graphs.
Curated OER
Mrs. Lewis's Pets: Tally Mark Activity
To cute to pass up! This slide show activity has learners count the number of pets Mrs. Lewis has using tally marks. As the show progresses, kids pay attention and make a tally for each type of pet they see. Suggested uses and audio are...
American Statistical Association
Bear Hugs
Scholars research arm span to determine who gives the best bear hugs. They use data from a national study to find the standard statistics for arm span. It includes mean, median, quartiles, spread, standard deviation, and more.
Curated OER
Operation Spaghetti
Find the math in recipes. Young chefs will follow a recipe and investigate the total cost for materials. They measure amounts of food necessary for the recipe and compute the per person cost.
Equality and Human Rights Commission
Learning area 4: Learn About the Meaning of Community
Scholars examine the jobs found in their community by way of surveying. After collecting data, pupils analyze their findings and share their observations with their peers. A video sparks interest. Two posters motivate participants to...
Bowland
Reducing Road Accidents
By making the following changes to the roads, we can prevent several accidents. A multiple-day lesson prompts pupils to investigate accidents in a small town. Pairs develop a proposal on what to do to help reduce the number of accidents....
Radford University
Snappy Stair Sprints
Let's go for a run. Small groups determine a way to collect data to determine the time it would take to run a set of stairs. After creating a plan, teams collect data and graph their results, calculating the equation of best fit and...
PBS
Adventures With The Fish Pond: Population Modeling
Build up from the previous activity where your learners charted the population growth and decay of a fish pond with M&Ms®. Have them look at the data from that activity and create a Now-Next, or recursive equations, to predict the...
US Department of Commerce
Creating and Taking a Survey
Individuals learn how to conduct surveys and collect data for the class on age, pets, and number of people at home. Scholars compare their household size to the information in the census. Pupils then develop additional questions to ask...
CCSS Math Activities
Smarter Balanced Sample Items: 6th Grade Math – Target F
Why does one person need 58 peaches; isn't that a bit excessive? This classic math dilemma offers pupils a chance to turn a word problem into an algebraic equation. Grade 6 Claim 1 Item Slide Shows includes this problem as part of a...
Curated OER
Yummy Math
Young mathematicians use bags of Skittles to help them gain practice in graphing and organizing data. They work in pairs, and after they have counted and organized their Skittles, they access a computer program which allows them to print...
Curated OER
Fish Communities in the Hudson
Learning to read data tables is an important skill. Use this resource for your third, fourth, or fifth graders. Learners will will study tables of fish collection data to draw conclusions. The data is based on fish environments in the...
Curated OER
Bar Graphs With Intervals
Give your math class a comprehensive understanding of bar graphs with this series of lessons. The resource is divided into three parts, and all of the accompanying worksheets are included. The class will study different bar graphs,...
Curated OER
Data Collection and Presentation
Students concentrate on discrete quantiative data. They are shown that the vertical line diagram as a more appropriate way to present discrete quantiative data then bar charts. Students work as a group to help with the interpretation...
Curated OER
Describing Data
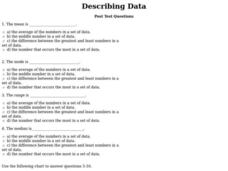
In this describing data worksheet, students answer multiple choice questions about mean, median, mode, and range. Students complete 10 questions total.
Curated OER
Types of Data
In this data chart worksheet, learners read the directions and study the examples to learn the difference between qualitative, quantitative, discrete and continuous data. Students answer 24 questions. This page is intended to be an...
Curated OER
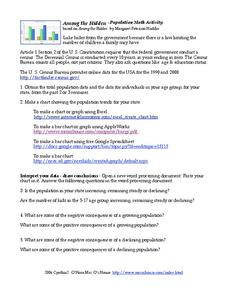
Among the Hidden - Population Math Activity
In this population worksheet, students collect data on population by researching the Census Bureau and then make online graphs and answer short answer questions about the data. Students complete 5 problems total.
Other popular searches
- Math Data Interpretation
- Math Analyzing Data
- Data/math Literature
- Math and Data Management
- Math Lesson Data Management
- Math Data
- Mathematics Chance and Data
- Math Lessons Organizing Data
- Math Data Collecting
- Math Bivariate Data
- Math/data Mean Mode Median
- Math Data Analysis


