Curated OER
Algebra II: Quadratic Functions
Students collect and organize data, make a scatterplot, fit a curve to the appropriate parent function, and interpret the results. Students translate among the various representations of the quadratic function, formulate equations, use a...
Curated OER
Draw Johann Sebastian Bach
Learners sketch a portrait of Johann Sebastian Bach. In this portrait lesson, students discover the elements of drawing a face. Learners manipulate curved lines and shading to create an original piece of art.
Curated OER
Worksheet 19
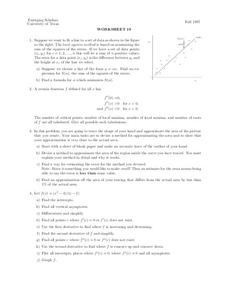
In this math worksheet, learners try to fit a line to a set of data. Then they use the least squares method is based on minimizing the sum of the squares of the errors.
Illustrative Mathematics
Foxes and Rabbits 3
Model periodic populations. Here, in the context of foxes and rabbits, pupils look at graphs of the populations of these animals in a national park over a span of 24 months. Groups analyze the graphs and determine trigonometric functions...
Curated OER
Graphing Scatterplots
Students examine scatterplots and determine the equation of a line using the slope-intercept method. Students interpret graphs, draw inferences, and sketch a curve of best fit for the graph. Based upon patterns in the graphs, students...
Curated OER
Exponential Functions: Half Life and Doubling Time
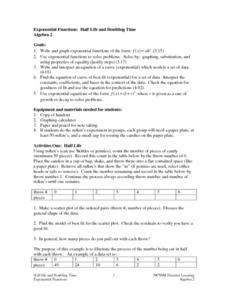
High schoolers investigate the concept of exponential functions and how they increase in size over time. They simplify the functions in order to find the solutions that are possible and perform analysis of the curved line that is...
Curated OER
Windsail Design
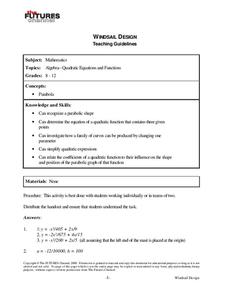
Students fit quadratic models to windsail designs. In this fitting quadratic models to windsail designs lesson plan, students compare quadratic models of sails with different measurements and mast size. Students vary the a-value for a...
Virginia Department of Education
Logarithmic Modeling
Explore logarithms and logarithmic regression. Young mathematicians first learn about inverse functions and about the logarithm function family. They take their newfound knowledge to use logarithmic functions to model situations and...
Virginia Department of Education
Exponential Modeling
Investigate exponential growth and decay. A set of six activities has pupils collecting and researching data in a variety of situations involving exponential relationships. They model these situations with exponential functions and solve...
Curated OER
The Way to Better Grades!
Pupils collect and analyze data. In this statistics lesson, learners create a scatter plot from their collected data. They use, tables and graphs to analyze the data and mae decisions.
Curated OER
Data and Scientific Graphs
Students conduct experiments and graph their data. In this statistics instructional activity, students collect data and graph it on a coordinate plane. They analyze the data looking for patterns and they discuss their findings with the...
Curated OER
Logistic Growth
Through the exploration of population growth of a bacteria population, young scholars learn about and observe bacteria population over a 20 hour period. Students graph the population growth using a scatter plot and discuss its logistic...
Mathematics Vision Project
Quadratic Equations
Through a variety of physical and theoretical situations, learners are led through the development of some of the deepest concepts in high school mathematics. Complex numbers, the fundamental theorem of algebra and rational exponents...
Curated OER
Walking the Plank
This is a cool math activity. Kids collect and interpret data based on a physical act. A board is balanced between a scale and a step, learners record a peer's weight as it decreases while s/he walks further away from the scale. They...
Virginia Department of Education
How Much is that Tune?
Tune in for savings! Scholars investigate pricing schemes for two different online music download sites. After comparing the two, they determine the numbers of songs for which each site would be cheaper.
Virginia Department of Education
Linear Modeling
An inquiry-based algebra lesson explores real-world applications of linear functions. Scholars investigate four different situations that can be modeled by linear functions, identifying the rate of change, as well as the strength and...
EngageNY
Nonlinear Models in a Data Context
How well does your garden grow? Model the growth of dahlias with nonlinear functions. In the instructional activity, scholars build on their understanding of mathematical models with nonlinear models. They look at dahlias growing in...
EngageNY
Choosing a Model
There's a function for that! Scholars examine real-world situations to determine which type of function would best model the data in the 23rd installment of a 35-part module. It involves considering the nature of the data in addition to...
It's About Time
Volcanic Landforms
Did you know the word volcano comes from the name of the Roman god of fire, Vulcan? During this activity, scholars make a topographic map, interpret topographic maps, and infer how lava will flow based on their analysis.
Curated OER
Stars and Slopes
More of a math lesson plan than physics or space science, high schoolers take a set of data and plot it on a log-log coordinate system. The write-up for day two was never completed, but day one, "Stars and Slopes," is complex and...
Radford University
Sleep and Teen Obesity: Is there a Correlation?
Does the number of calories you eat affect the total time you sleep? Young mathematicians tackle this question by collecting their own data and making comparisons between others in the class through building scatter plots and regression...
Curated OER
Determination of Phosphorus Content in River Water
Divide your chemistry or environmental science class into two groups. Each group tests water samples from a river for the concentration of phosphorus using a different method. With chemists, you can use this activity as they learn to use...
Curated OER
View Tubes: Student Worksheet
Here is a activity that is almost a lesson! In it, learners conduct an experiment in which they determine the size of objects when viewed through viewing tubes. This resource has all of the instructions and tables necessary to complete...
Curated OER
Matrix Analysis of Networks
Explore the connection between a finite graph, a directed graph, and a matrix. Graph lines and identify the relationship of matrices in real-world scenarios. Then use this information to work with a partner to plan and design a town...


