Curated OER
M&M Graphing and Probability
Students create a variety of graphs. They count, sort, and classify M&M's by color and record data on a chart. They use data from the chart to create pictographs, bar graphs and circle graphs. They analyze data and determine...
Curated OER
Graphing at all Levels: It's a Beautiful Thing!
Mixing math and art is done in this activity by applying graphing knowledge to create a unique piece of art. This activity varies acording to the graphing knowledge of the artist. First, learners identify and review various types of...
Curated OER
Graphing with Stems-and -Leafs
Fourth graders examine the use of stem and leaf graphs. In this stem and leaf graph lesson, 4th graders participate in teacher led lesson showing the use of the graphs. They work in groups to collect data about peanuts before making a...
Curated OER
Application of Graph Theory
Students investigate different online tutorials as they study graphing. In this graphing activity, students apply the concept of graphs cross curricular and use it to make predictions. They define the purpose and theories behind graphs.
Mathematics Assessment Project
Sorting Equations of Circles 2
How much can you tell about a circle from its equation? This detailed lesson plan focuses on connecting equations and graphs of circles. Learners use equations to identify x- and y-intercepts, centers, and radii of circles. They also...
Curated OER
Making Graphs
Students explore statistics by conducting class demographic surveys. In this graph making lesson, students identify the family members of each classmate, pets they own, and favorite activities. Students organize their statistics and...
Curated OER
Looking for More Clues
Fifth graders explore how to collect data and display it on a bar and circle graph.
CK-12 Foundation
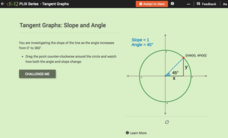
Tangent Graphs: Slope and Angle
Learning about tangents doesn't have to be a slippery slope. Pupils drag a point around a unit circle to see how angle affects the slope of a line. They individually answer a set of challenge questions to come to the conclusion that...
Curated OER
Math Handbook: Trigonometry
You'll be spinning in unit circles once you read through this jumbo-sized resource of everything you need to know about trigonometry. Each page has color-coded examples with explicit directions that detail the problems and...
Curated OER
Graphing Using Cookies
Students differentiate between bar graphs, line graphs, pictographs and bar graphs. After participating in a hands-on cookie activity, students label and draw their own graphs.
Curated OER
Which Graph is best?
Students use commercial software to organize and visually display data to draw conclusions; students use graphing software to create several types of graphs illustrating the number of each color of M&M's in one bag.
Curated OER
Decisions, Decisions, Decisions
Students examine graphs to find the most appropriate for various kinds of data. In this graphing lesson, student create bar, line and circle graphs. Students create graphs electronically and manually interpreting the data.
Curated OER
Great Graphing
Young scholars collect data, use a computer spreadsheet program to create various graphs, and compare the graphs. They state the findings of each graph in writing and decide which graph type best represents the data.
Curated OER
Graphing Lesson Plans
By using hands-on graphing lesson plans students can learn how to collect data, and display the information using graphs.
Curated OER
MAP Practice
In this geometry activity, students create circle, line and bar graphs using different comparisons of events. There are 24 questions with an answer key.
Curated OER
Are You Full of Hot Air?
Explore the concept of measuring and recording circumference. In this physical science and measurement lesson, young learners blow up balloons, measure the circumference, and record the data on an interactive graphing website.
Curated OER
Favorite Fruit
In this graphing worksheet, 1st graders create a bar graph showing the favorite fruits of their classmates. They analyze their bar graph by answering five comprehension questions.
Curated OER
Graphs, Stories, And Games
In this graphs lesson, young scholars read stories and present story situations on a graph. They explore distance and diameter and explain graphs. Students create their own stories to fit graphs.
Curated OER
Excel temperature Graphs
Students gather data about the weather in Nome, Alaska. In this Nome Temperature lesson, students create an excel graph to explore the weather trends in Nome. Students will find the average weather and add a trend line to their graph.
Virginia Department of Education
Quadratic Curve of Best Fit
Class members create a table of the number of chords that can be drawn given the number of points on a circle. Pupils analyze the data created, find a function to fit to it, and use the function to make further predictions.
Math Moves U
Collecting and Working with Data
Add to your collection of math resources with this extensive series of data analysis worksheets. Whether your teaching how to use frequency tables and tally charts to collect and organize data, or introducing young...
CK-12 Foundation
Pie Charts: Soda Party
Using the interactive, pupils create a pie chart that represents the percentage of sodas bought for a party. Individuals need to determine the percentage and number for the final variety of drinks. The learners determine how the...
Curated OER
Match The Graph Circles
High Schoolers engage in a study of circles and graphs that are related with the focus upon finding the center and radius. The lesson includes the suggestion of giving homework using circle problems before this one to create background...
Curated OER
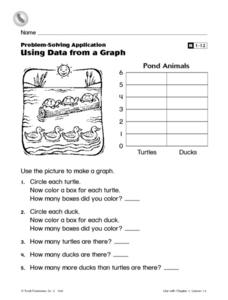
Using Data From a Graph
In this graphing worksheet, students create a bar graph with information from a picture of some pond animals. Students answer 5 questions about the graph.


