Statistics Education Web
The United States of Obesity
Mississippi has both the highest obesity and poverty rate in the US. Does the rest of the data show a correlation between the poverty and obesity rate in a state? Learners tackle this question as they practice their skills of regression....
Curated OER
Grid Frame Mapping
Students map and describe small area of the schoolyard and discuss habitats.
Curated OER
N is for Natural State
For any pupils who live in the state of Arkansas, this would be a fabulous educational experience to help them get to know their state better. Through the use of activities in literature, art, mathematics, science, social studies, and...
Curated OER
MAPPING YOUR NEIGHBORHOOD
Students uses atlases, maps, and Web resources to generate and examine maps of their own neighborhoods. This activity serve as background for the map-reading tasks in the next lessons.
Curated OER
Touring the Regions of the United States
Fifth graders explore the regions of the United States. They use maps, research on the Internet and use measurements and estimations. Students create a presentation using spreadsheets and publishing software.
Education World
The African American Population in US History
How has the African American population changed over the years? Learners use charts, statistical data, and maps to see how populations in African American communities have changed since the 1860s. Activity modifications are included to...
Discovery Education
Architects in Action
Hands-on and real-world applications are great ways to teach mathematical concepts. Creative thinkers examine how ratios are used to create scale models of buildings and structures. They practice working with ratios by looking at a map...
Teach Engineering
Where Are the Plastics Near Me? (Mapping the Data)
The last activity in a nine-part series has teams create a Google Earth map using the data they collected during a field trip. Using the map, groups analyze the results and make adjustments to the map to reflect their analysis. A short...
Curated OER
How Far Is It?
Students use a map key to estimate the distance from Salt Lake City, Utah, to ten other cities. Then they use an online distance calculator to see how close their estimates come!
Illustrative Mathematics
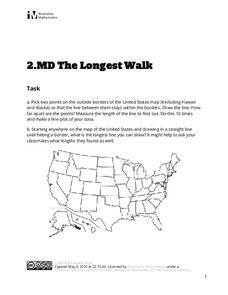
The Longest Walk
How long of a line can you draw within this activity? Learners pick two points outside and within the map to create the longest line they can. After drawing 10 lines, learners plot the length of each line on a line plot. Then they...
Curated OER
Creating a Map for Future Reference
Students use Web and other resources to create maps of either the site of their day trip, their final destination, the entire trip, or some combination of these.
Curated OER
Places and Production
High schoolers calculate United States GDP and GDP per capita, use a choropleth map to acquire information, and create choropleth maps of GDP per capita in South America. They identify regions with high and low GDP per capita
Curated OER
Mapping Meteorites
After reading an article, "Cameras Capture a 5-Second Fireball and Its Meteorite's Secrets," space science superstars use the triangulation method to determine the location of a distant object. In-class activities and homework are...
Curated OER
Discovering New Mexico
Seventh graders discuss the elements of maps and using basic linear measurement. They calculate the distance between the cities and create a simulated journey around New Mexico using a road map. They write out the directions for their...
Curated OER
Popcorn Geography
Students use kernels to create a "Top Corn-Producing States" map or graph. They read and round off numbers. Students identify on a U.S. outline map the location of corn-growing states. They create a visual (map or graph) illustration...
Curated OER
It's Greek to Me!
Students explore Greek Mythology. In this Greek Mythology unit, students read myths, pantomime vocabulary words, practice research skills, create city-states, and demonstrate knowledge of ratios and proportions. This unit includes many...
Curated OER
Geography Journey
Fourth graders examine the geographic features that define places and regions and answer questions about the state of California. They discuss the components of a map legend and answer worksheet questions using a map of California as a...
Curated OER
City, County, Community
Students explore issues and situations that make for a city and its local environments. In this local government lesson, students design maps, define issues and create brochures that illustrate their understandings of these concepts and...
Mathematics Assessment Project
Building and Solving Linear Equations
Young scholars write and solve linear equations in one variable based on descriptions of the operations that are applied to the unknown variable in an algebra machine. They then create their own problems for classmates to solve.
Mathematics Assessment Project
Increasing and Decreasing Quantities by a Percent
As part of a study of percent and percent change, learners first complete an assessment task with several percent change problems. They then complete an activity using cards to create a diagram expressing percent increases and...
Curated OER
Proofs of the Pythagorean Theorem
Working individually and collaboratively, geometers gain a clear understanding of the Pythagorean theorem. They create, explain, and compare proofs of the theorem. Proofs involve areas of trapezoids, squares, and triangles, congruent...
Mathematics Assessment Project
Estimating Length Using Scientific Notation
Would you rather have a million dollars or 1 x 10^6 dollars? To find the answer to this question, class members first complete an assessment task converting numbers between decimal notation and scientific notation. They then take...
Curated OER
Apple Logic and Problem Solving
Young scholars examine apple production in the United States. For this interdisciplinary lesson, students use problem solving strategies introduced to solve math problems associated with apple production in the United States. Student...
Curated OER
People On The Move
Students describe patterns of internal migration in the United States, past and present and evaluate implications of internal migration. They examine population movement at the state and local levels.


