Curated OER
Taking Its Toll
Students explore ratios. In this rates lesson, students create a ratio to compare the price of a toll to the distance travelled. They compute the average cost per mile, determine the slope between two ordered pairs, and make...
Curated OER
Fitting Periodic Functions-Distant Planets
In this periodic functions worksheet, students use given data of the speed of a star and find the best fit periodic function that follows the trend in data. They determine the amplitude, offset phase and the formula for the angle. They...
Curated OER
Discovering Pi
Students develop a formula that describes the functional relationship of the circumference of a circle to its diameter. Working with a partner, they measure the diameter and circumference of circular objects in order to discover the...
101 Questions
Coins in a Circle
Round and round you'll go! Learners watch as different-sized circles fill with coins. They collect data and then make a prediction about the number of coins that will fit in a large circular rug.
Curated OER
Line of Best Fit
Students explore the concept of linear regression. In this linear regression lesson, students do a Barbie bungee activity where they collect linear data. Students plot their data using a scatter plot. Students determine a line of best...
Curated OER
Line of Best Fit
Students identify the line of best fit. In this statistics lesson, students collect and analyze data. They calculate the regression equations and identify the different types of correlation.
Curated OER
Finding a Line of Best Fit
Pupils engage in the practice of creating a scatter plot with the data obtained from measuring different resting heart rates. The data is used to create the table that is translated into a graph. The lesson gives instructions for the use...
Inside Mathematics
Vencent's Graphs
I like algebra, but graphing is where I draw the line! Worksheet includes three multiple-part questions on interpreting and drawing line graphs. It focuses on the abstract where neither axis has numbers written in, though both are...
Curated OER
Linear and Exponential Models
Students investigate the differences between linear and exponential models. In this linear and exponential models lesson, students make a table of given data. Students determine if the data is linear or exponential by plotting the data...
Mathalicious
Pic Me!
Finally! Math and Instagram have come together to discuss the correlation between likes and followers. High schoolers can't help but want to discover what makes one account more popular than another by developing a line of best fit and...
Rochester Institute of Technology
Artificial Lung and Diaphragm
She had a terribly busy day converting oxygen into carbon dioxide; now she just needs a moment to breathe. In the activity, scholars review the function of the respiratory system and discuss bioengineering's role in medicine/health and...
Curated OER
Graphing and Analyzing
In this graphing and analyzing worksheet, 9th graders first state if each graph represents a linear or nonlinear relationship. Second, they create a difference table for each set of data presented and determine whether it represents a...
Curated OER
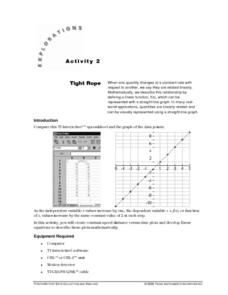
Tight Rope
Learn how to explore the concept of linear functions. In this linear functions lesson, students collect linear data from a motion detector. Students walk to create a linear function. Students plot the points on a graph and determine a...
Curated OER
Can You Make a Hole in One?
Young scholars relate miniature golf to reflection of an image. In this algebra lesson, students collect and graph data as they study linear equations. They apply properties of graphing to solve real life scenarios.
Curated OER
Strike a Pose: Modeling in the Real World (There's Nothing to It!)
Adjust this lesson to fit either beginning or more advanced learners. Build a scatter plot, determine appropriate model (linear, quadratic, exponential), and then extend to evaluate the model with residuals. This problem uses real-world...
NBC
Nutrition, Hydration, and Health
NFL football in science class? Yes, please! In an engaging and motivating three-day lesson, kids take a look at their own nutritional habits and needs compared to those of an NFL player, then experiment with the effects of hydration on...
Curated OER
Linear Modeling: Functions
Students analyze linear functions. In this algebra lesson, students create a linear model to relate coordinate pairs. They evaluate and solve equations.
Teach Engineering
An Inflated Impression of Mars
Help your class understand the magnitude of the distance between Earth and Mars with an activity that asks small groups to use balloons to create scale models of the Earth, Moon, and Mars. Class members figure out the distances between...
Kenan Fellows
Reading Airline Maintenance Graphs
Airline mechanics must be precise, or the consequences could be deadly. Their target ranges alter with changes in temperature and pressure. When preparing an airplane for flight, you must read a maintenance graph. The second lesson of...
Curated OER
Linear Patterns in Data
Eighth graders extend their learning of graphing linear equations and are introduced to connecting patterns in tables and graphs to represent algebraic representations. They then determine patterns and extrapolate information from these...
Curated OER
Solar Flare Reconstruction
In this solar flare reconstruction worksheet, students read about the 'saturation' point of satellite detectors when solar flares are at their most intense phase of brightness. Kids are given x-ray flare data and they re-plot the data to...
Curated OER
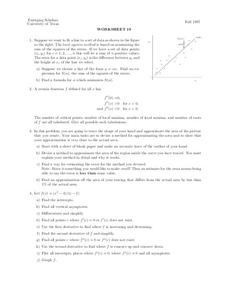
Worksheet 19
In this math instructional activity, students try to fit a line to a set of data. Then they use the least squares method is based on minimizing the sum of the squares of the errors.
Curated OER
Pseudogene Suite
Students use Biology Workbench to explore DNA sequence data for the GULOP gene in humans, chimpanzees, orangutans, and crab-eating macaques and the beta globin gene and its pseduogene in humans, gorillas, and chimpanzees.
Curated OER
Data Collection Project
Students collect data using email. They calculate the mean, median, mode, range and outliers. They create a graph using the data results. They write five paragraphs to summarize their data.


