Intel
How Can I Relate?
How much is a million? This unit has a set of lessons investigating large numbers on the order of millions and billions. A culminating project has groups creating a slideshow and poster about large numbers found in the school and/or...
Curated OER
Million Dollar Project
Each student is given the task of spending $1 million. The way students spend their money is dependent on a theme such as "creating a dream world," "taking a trip," or "doing something to better society." Each student researches,...
Curated OER
Graphing Pockets
Second graders explore graphing. They count the number of pockets on their clothes and use Microsoft Excel to enter their data. Students create a class graph displaying their findings.
Curated OER
Fractions
Fourth graders explore fractions. They use Skittles and M&M's to practice adding and subtracting fractions. Students review the numerator and the denominator of fractions. They count the number of each color of Skittles and M&M's...
Curated OER
Chapter Books
In this line plot worksheet, students create a line plot of the chapter books read by the students of a class and find the median and mode. Students complete 3 tasks.
Curated OER
Variation
In this variation learning exercise, students interpret and organize data. They find the distance between points. Students use ratios to determine volume This six-page learning exercise contains approximately 20 problems. Answers are...
Curated OER
Scale Matters
Third graders study the meaning of the digits an any whole numbers with up to 3 decimal places. They order decimals with up to 3 decimal places and perform measuring tasks, using a range of units and scales.
Illustrative Mathematics
Buttons: Statistical Questions
Here is a nice activity about recognizing the difference between a statistical question and answer and one that anticipates a fixed answer. From this, your future statisticians will develop an understanding of variability and be able to...
Illustrative Mathematics
Chocolate Bar Sales
In this real-world example, algebra learners start to get a sense of how to represent the relationship between two variables in different ways. They start by looking at a partial table of values that define a linear relationship. They...
Howard County Schools
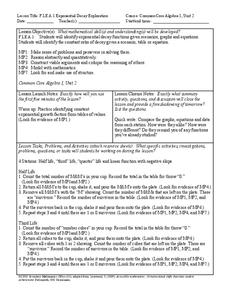
Exponential Decay Exploration
How can you model exponential decay? Explore different situations involving exponential decay functions and decreasing linear functions by performing activities with MandM candy, popcorn kernels, and number cubes.
Illustrative Mathematics
Ice Cream Van
In an open-ended problem, learners calculate costs involved in driving an ice cream van. Is it better to park in one place or drive through different neighborhoods? Learners look at these and other factors and must make reasonable...
Curated OER
Flip a Coin
Young scholars are introduced to the concept of probability. In groups, they make a prediction about how many times a coin might show heads or tails when flipped. They carry out the experiment and record their results to compare it to...
Curated OER
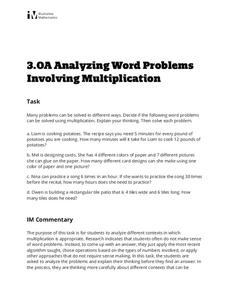
Analyzing Word Problems Involving Multiplication
Learners sometimes have difficulty making sense of a word problem. In a guided learning activity, pupils are asked to think about how to find an answer and explain their thinking, rather than finding the answer. It allows them to...
Curated OER
Learning Number Words
Students practice saying their numbers and identifying the words. They use whole numbers and decimals to practice grouping numbers into different categories. They write the word of the number they are shown.
Illustrative Mathematics
Sarah, the chimpanzee
Is Sarah, the chimpanzee, smart or just a lucky guesser? Here, learners set up a simulation and read a dotplot to find out the likelihood of getting 7 out of 8 questions correct. One suggested modification would be to have your class...
Curated OER
Thank You... Thomas Edison!
Learners investigate the life of Thomas Edison. They research how he made a difference. They understand that accurate data collection is important for math. They create a chart using spreadsheet data.
Curated OER
Pictograph to Bar Graph
Second graders explore organizing data to make it useful for interpreting picture graphs and bar graphs. They use Graphers software to create a pictograph and a bar graph.
Curated OER
Graph It!
First graders use organized data to construct real object graphs, picture graphs, and bar-type graphs.
Curated OER
Double Dipping
Fifth graders determine how many double scoop combinations they can make using 5 different ice cream flavors. Then they use Microsoft Publisher to create a brochure for their ice cream shop.
Curated OER
Budgeting 101
Students identify various sources of income and discern between needs and wants as they also learn to create a personal budget. In this personal budget lesson plan, student understand financial scenarios as they relate to different ways...
Fuel the Brain
Egg Hunt Pictograph
If you did a hypothetical egg hunt in class, wouldn't it be great to see how many eggs were collected? Your youngsters will receive a list of "collected data" and create a pictograph.
Curated OER
Raisin Cane
Students estimate and record the number of raisins in a snack-size box. They also graph their results and note the differences (+ or -) from their estimate and actual number.
Curated OER
Which Color Will You Pick?
Students create a spreadsheet to chart the different colors found in a package of M&M's or Skittles. They collect data, create appropriate charts, and use percentages to describe quantities.
Curated OER
Graphing Using Excel
Fifth graders complete a series of graphs by gathering information and using Excel to graph the information. In this graphing lesson, 5th graders graph favorite desserts of the class. Student put their results into the computer and then...


