Curated OER
How Many More on a Graph?
First graders examine data on a graph and determine which variable on the graph has more. They draw pictures of their family members and determine which families have more members than other families. Using squares of paper to depict...
Curated OER
How Many More on a Graph?
First graders identify a number that is one more or one less than a number up to one hundred and identify a mystery number. They also create a class graph that illustrates how many children are in each family, and answer questions about...
Techbridge Curriculum
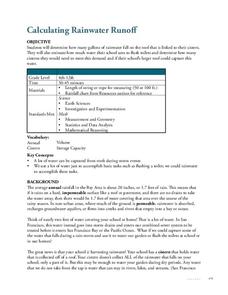
Calculating Rainwater Runoff
Thirsty plants soak up every bit of a rainfall, but what happens to the rain that hits the roof? Calculate the amount of rainwater from your school's roof with an Earth science activity, which brings measurement skills, observation...
Visa
Earning Money
Where does money come from? Is it limitless and always available? Introduce your youngsters to the concept of earning through jobs and/or chores with a matching activity and provided worksheets.
Curated OER
Texting and Grades II
Given the least squares regression line, interpret the slope and intercept in the context of the relationship between texting and GPA. Although this task is short and looks simple, some subtle points can be brought to light in a...
Curated OER
Kinzi Deaf Alumni
Pupils use data of school alumni to create a database. The lesson uses technology and access to a computer lab is essential. The concepts of graphing statistics is also used to help teach across the curriculum.
Curated OER
Weather, Weather, Everywhere!
Sixth graders collect weather data to compare temperatures around the world. Using the Internet, learners collect data, put it into spreadsheets, and analyze and graph the results. An interesting way to cover the topic of weather.
Illustrative Mathematics
Springboard Dive
Dive into this problem that illustrates a real-world application of the quadratic formula. Learners are given an equation that represents the height of a diver above the water t seconds after leaving the springboard. The task is to...
Curated OER
Everyone's Playing Basketball
To foster number sense and build problem solving skills, pupils will work through a complex word problem. They will be asked to analyze the data given, solve the problem, then share their thinking process with the class. This activity...
Curated OER
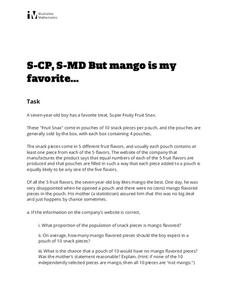
But mango is my favorite…
What are the chances of getting your favorite flavor in your fruit snack package? Have your class use the given information to compute their own experimental data using the multiplication rule of independent events and compare it to the...
Illustrative Mathematics
Global Positioning System II
Intricate details of a modern technology that many of us take for granted in our phones, computers (and some cars) are laid bare in a short but deeply investigative activity. The math behind a seemingly simple GPS device is...
Curated OER
Color Tile Graphing
Students explore data. They gather data and generate questions about the data in pictographs, tallies, tables, and bar graphs. Students use color tiles pulled by random to create their own bar graph. They discuss the bar graphs they...
Inside Mathematics
Graphs (2006)
When told to describe a line, do your pupils list its color, length, and which side is high or low? Use a instructional activity that engages scholars to properly label line graphs. It then requests two applied reasoning answers.
Balanced Assessment
Stick Patterns
Sticks and stones may break my bones, but these sticks will make me smarter. Pupils examine arrays of sticks to determine the next array in a pattern. They use the number of sticks added to each previous array to determine a recursive...
Mathematics Vision Project
Quadratic Functions
Inquiry-based learning and investigations form the basis of a deep understanding of quadratic functions in a very thorough unit plan. Learners develop recursive and closed methods for representing real-life situations, then apply these...
Curated OER
US Airports, Assessment Variation
Determining relationships is all part of algebra and functions. Your mathematicians will decide the type of relationship between airports and population and translate what the slope and y-intercept represent. The problem is multiple...
Pennsylvania Department of Education
Adding and Subtracting Three-Digit Numbers by Jumping
Second graders use data to graph information and draw conclusions. In this instructional activity on data analysis, 2nd graders practice gathering, sorting, comparing, and graphing data. Students differentiate data that can and cannot...
Curated OER
Math & Social Science
Students are given data and are to calculate averages and yearly totals of how many cars travel the Tacoma Narrows Bridge. They also make a graph of the data.
Curated OER
Pick's Theorem
Students investigate polygons and their lattice. In this calculus instructional activity, students record data using different methods. They analyze their data and draw conclusions based on the relationship between the area and the...
Curated OER
Apple Baskets
In this counting apples worksheet, students color and cut out four apple baskets with specific numbers on them and twenty-five apples. Students fill each basket with the specific number of apples requested.
Curated OER
Fractions of a Sheet Cake
Second graders become familiar with the fractions in a whole. In this sheet cake lesson plan, 2nd graders view a Count on it clip about pumpkin pies. Students cut a sheet cake into eight parts and write as a fraction. Students...
Curated OER
A Day to Remember!
Students study math. In this real-life problem solving lesson, students work on their skills dealing with time and money. They work in small groups on various time and money word problems and by the final day they have a final problem...
Curated OER
Approximation of Pi
Students explore the concept of Pi. In this Pi lesson plan, students measure the circumference and diameter of a circle. Students record the diameter and circumference measurements from their classmates. Students enter the data into...
Curated OER
Jelly Bean Statistics
Learners develop a process of packing jelly beans efficiently. For this math lesson, students explain the quality control methods they designed. They construct histograms using Excel spreadsheet.


