Curated OER
Count and Color M&Ms
In this counting and coloring worksheet, students observe rows with numbers and graphics of M&Ms, read the number in the first box, and count and color the correct number of M&Ms in the second box. Students color five rows of...
American Psychological Association
A Tasty Sample(r): Teaching about Sampling Using M&M’s
Here's a sweet activity! As part of a study of psychological research methods and statistic gathering, individuals develop a hypothesis about the number of each color of M&Ms in a fun-size package. They then count the number of each...
Curated OER
M&M’s Math Worksheet
Who knew you could cover prediction, histograms, fractions, decimals, data collection, and averages (mean, median, and mode) all with a bag of M&M's®? Here's a fantastic set of worksheets to help you make candy a mathematical journey...
Curated OER
The Color of M and M's
In this math worksheet, students sort out the colors of candies. Then they count each color and create a flowchart. Finally they create a ratio for each color in comparison to the total number of candies.
Curated OER
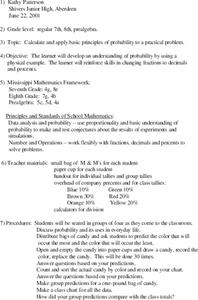
Probability using M & M's
Using M & M's candies, young statisticians predict the color distribution in a packet of candies and test their predictions against their group and the larger class. A review of converting between fractions, decimals, and percents...
Curated OER
M&M Math
Students sort a bag of M&M candies according to color using a sorting mat. They count M&M candies. They compare the number to their prediction then students create tally charts.
Curated OER
Candy Colors: Figuring the Mean, Median, and Mode
Students count candy by color and then calculate mean, median, and mode. They count candy and use the data to calculate mean, median, and mode (by color) and apply their learning to another collection of data.
Curated OER
Comparing M & M's
In this comparing worksheet, 2nd graders count up the numbers of different colored m & m's and then answer questions about comparing each color. Students complete 4 questions.
Curated OER
M & M's Candy Color Chart
In this graphing worksheet, students open a package of M & M candies and use this prepared graph to record how many of each color are present.
Curated OER
M&M Counting Chart
Students practice classifying objects while utilizing candy. In this sorting lesson, students observe an assortment of M&M's and analyze the candy based on color. Students create a color chart based on the number of different...
Curated OER
M&M Counting Fun
Students count up to 10 or more M & Ms using verbal names and one-to-one correspondence, as well as use sets of M & Ms to represent quantities given in verbal form.
Curated OER
M&M's and the Scientific Method
Sixth graders explore the scientific method by conducting an in class experiment. In this scientific averages lesson, 6th graders discuss the concept of the scientific method, and define the different mathematical averages, mean, median...
Curated OER
Valentine M&M's Math
In this Valentine M&M's math activity worksheet, students count their M&M's, sort them by color, make a pattern with them, and create a graph showing how many of each color they have.
Curated OER
Counting Cheerios
Students demonstrate counting to 10 or 20. They read and discuss "The Cheerios Counting Book," match number cards to Cheerios, and create a Cheerios necklace.
Curated OER
M & M Madness
M&M's are always a great manipulative to use when teaching math. In this graphing lesson plan, learners predict how many of each color of M & M's there are. They count up each color and plug the data into a graph using the...
Curated OER
Show Me The Data!
Pupils create a bar graph. They will collect and organize data to turn into bar graphs. They create graphs for the favorite sports of the class, color of M&M's, and types of cars passing by.
Curated OER
Math: How Many Red M&Ms?
Sixth graders calculate the mean, median, and mode of candy M&Ms and find the percentage of each color. Once they complete the assignment, they compare their results with those of the candy company's percentages. As an extension,...
Curated OER
Bunny Mix M&M's Math
In this Easter M&M's math activity worksheet, students count their M&M's, sort them by color, make a pattern with them, and create a graph showing how many of each color they have.
Curated OER
Statistics of Mars
Students explore the concept of central tendencies. In this central tendencies lesson, students sort M&M's or Skittles based on color. Students graph their results. Students find the mean, median, and mode of their data.
University of Arizona
Skittles & M&Ms Probability Experiment
Students are introduced to the scientific method by hypothesizing, counting, analyzing and concluding which company packs candy more reliably - Skittles or M&Ms.
Curated OER
Probability Using M&M's
Students estimate and then count the number of each color of M&M's in their bag. In this mathematics lesson plan, students find the experimental probability of selecting each color from the bag. Students create pictographs and bar...
Curated OER
Magic Monster Letter M
In this letter m learning exercise, learners use a yellow crayon to color every letter m next to the Magic Monster and use a black crayon for any letter that is not an m. Students count the yellow m's and write that number in the box....
Curated OER
Spicy Hot Colors
First graders discover the importance of primary colors by reading a book in class. In this art lesson, 1st graders read the book Spicy Hot Colors, and discuss the three primary colors and the numerous combinations they can make....
Curated OER
Teaching fractions & ratios with M&Ms
Students collect data using M&Ms, fill in charts, and write ratios and fractions for each color M&M.


