Curated OER
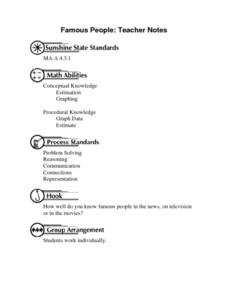
Famous People: Teacher Notes
Young statisticians practice creating scatter plots. First, they estimate the age of 14 people. Next, they write down the estimate in a table labeled x. Then write down their actual age in the table labeled y. Using these x and y...
MARS, Shell Center, University of Nottingham
Defining Regions Using Inequalities
Your young graphers will collaboratively play their way to a better understanding of the solution set produced by the combining of inequalities. Cooperation and communication are emphasized by the teacher asking questions to guide the...
Curated OER
Graph Linear Inequalities
In this algebra activity, students solve linear inequalities and graph their results on a coordinate plane. They shade the correct side of the line. There are 8 questions with an answer key.
Curated OER
XY Graph
In this math worksheet, learners practice graphing ordered pairs, linear equations, or quadratic equations using this graph with the x and y axis.
EngageNY
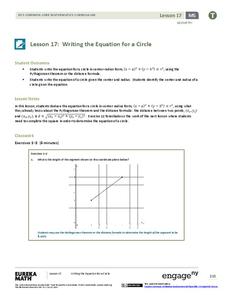
Writing the Equation for a Circle
Circles aren't functions, so how is it possible to write the equation for a circle? Pupils first develop the equation of a circle through application of the Pythagorean Theorem. The lesson then provides an exercise set for learners to...
Curated OER
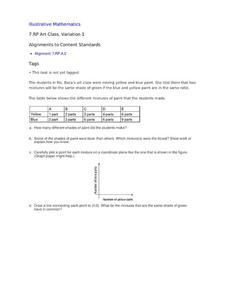
Art Class, Variation 1
Student statisticians calculate ratios to determine how many shades of green were mixed by Ms. Baca's art class. They graph the number of blue parts against the number of yellow parts for each combination and discover that some produce...
Flipped Math
Reflections
Take some time to reflect on graphing. Learners count a point's distance from the line of reflection to create reflections of geometric figures. Given the rules for four basic lines of reflections, pupils determine the points to create...
Curated OER
Measuring Segments
In this measuring segments activity, 10th graders solve 12 different problems related to determining the measurements of various segments. First, they determine each missing measure given the information. Then, students find the value of...
Curated OER
Exercises in Plotting Points
In this geometry worksheet, students practice plotting points on coordinate grids. They plot and translate points in 6 grids.
Georgia Department of Education
The Basketball Star
Have learners use math to prove they are sports stars! Assess a pupil's ability to create and analyze data using a variety of graphs. The class will be motivated by the association of math and basketball data.
School Mathematics Project
Resource Sheets
This extensive and far-reaching collection of worksheets puts a new twist on many basic concepts. Learners use multiplication to trace a path from one point to another, tile a plane by converting between improper and proper fractions,...
Curated OER
Plotting Points
In this coordinate pairs worksheet, students learn to plot points on a graph. Students study the examples and then complete 20 questions. This is intended as an online activity, but may be completed with pencil and paper.
Curated OER
Locate Ordered Pairs
In this ordered pairs worksheet, students solve and graph 6 different graphs that include various ordered pairs. They determine each ordered pair shown in the graphs. Then, students write the letter for the point named by the ordered...
Illustrative Mathematics
Two Lines
Here is a resource that helps your algebra learners understand the connection between the graph of two lines, the equations of lines, and the solutions and intersecting points of lines. It would make a great assessment question, but can...
Curated OER
Domain and Range
In this domain and range activity, students write the definitions for relation, function, domain and range. They then find the domain and range of 7 sets of ordered pairs. Finally, students answer 4 questions regarding inverse relations...
Curated OER
Graphing Linear Equations
In this math worksheet, students practice graphing the linear equations on the Cartesian plane. They also create a function table for each.
Curated OER
SAT Grid Practice Test 11
In this SAT practice test, students compute the area and perimeter of polygons. They determine the volume of a cylinder and solve problems with exponents. This one-page worksheet contains 10 problems. Answers are provided.
Inside Mathematics
Functions
A function is like a machine that has an input and an output. Challenge scholars to look at the eight given points and determine the two functions that would fit four of the points each — one is linear and the other non-linear. The...
EngageNY
Finding Systems of Inequalities That Describe Triangular and Rectangular Regions
How do you build a polygon from an inequality? An engaging lesson challenges pupils to do just that. Building from the previous lesson in this series, learners write systems of inequalities to model rectangles, triangles, and even...
Curated OER
Finding Domain and Range
In this domain and range worksheet, students observe a graph and identify the domain and range of given functions. Afterwards, they solve functions to identify the range. Fifteen problems are provided on this one-page worksheet.
Illustrative Mathematics
Walk-a-thon 1
Your mathematician's job is to explore the relationship between hours and miles walked during a walk-a-thon. The activity compels your learners to experiment with different means in finding out this proportional relationship. The answer...
Illustrative Mathematics
Walk-a-thon 2
During a walk-a-thon your learners must determine the walking rate of Julianna's progress. Using tables, graphs, and an equation, they must be able to calculate the time it took her to walk one mile and predict her distance based on the...
Illustrative Mathematics
The Circle and The Line
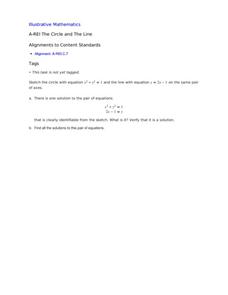
Here is a resource where algebra learners show their understanding of a system of equations involving a circle and a line. Once graphed, learners see two points of intersection, one where the ordered pair is read, and a second where...
Georgia Department of Education
Math Class
Young analysts use real (provided) data from a class's test scores to practice using statistical tools. Not only do learners calculate measures of center and spread (including mean, median, deviation, and IQ range), but...
