Curated OER
Worksheet 7 Computer Lab
In this math worksheet, students program the computer to display a direction field plot for an equation. They plot several solutions on a graph.
Curated OER
Reading & Using a Nutrition Label
Students discover the importance of healthy eating. Using food nutrition labels, they read and examine the nutritional value. Students collect the data on a spreadsheet and create a graph. They analyze the media influences on product...
Curated OER
Steppin' Out
Students are presented with the question: "Do longer legged people run faster than shorter legged people?" Students conduct an experiment, collect their data, create box and whisker plots using a computer and graphing program, and...
Curated OER
Dashboard of the Future
Students design dashboards for vehicles in 2020. After researching past and current trends in vehicle design, they sketch alternatives and select one to draw with computer-assisted design software (CAD), labeling all the components. With...
Inside Mathematics
Graphs (2006)
When told to describe a line, do your pupils list its color, length, and which side is high or low? Use a worksheet that engages scholars to properly label line graphs. It then requests two applied reasoning answers.
Curated OER
Angles All Around Us
Explore with your class the characteristics of acute, obtuse, right, complementary, and supplementary angles. They take digital photographs around the school and identify the angles in the images. Uisng software, they label and...
Shodor Education Foundation
Scatter Plot
What is the relationship between two variables? Groups work together to gather data on arm spans and height. Using the interactive, learners plot the bivariate data, labeling the axes and the graph. The resource allows scholars to create...
Shodor Education Foundation
Measures
Take a look at data from a statistical lens. An interactive allows pupils to enter data set, labeling the data including the units used. Manipulating the applet, learners select the statistics to calculate that include total, mean,...
Curated OER
This is the Way We Go To School
Second graders create and utilize a graph using the Excel computer program. They gather data regarding how the students get to school, tally the numbers for the class, and create a bar graph on paper and using Excel.
Curated OER
Mathematics & Nutrition
Learners apply math to calculate fat and calories in the food they eat. They examine food package information to become aware of the ingredients and to learn about healthy life styles. They work in groups to create crazy meals using the...
Curated OER
Blast the Fats
Students examine the fats found in foods. In this nutrition lesson, students identify the types and amounts of fats found in foods as they research food labels and the Internet. Students classify the fats and record their data.
Curated OER
Favorite Food
Students are given three choices of food. They then decide on their favorite and predict what the class's favorite food will be. After the teacher enters the data into the computer, students gather around the computer to view the...
Curated OER
Number Sense and Numeration
Students add and subtract integers. In this algebra lesson, students discuss number sense as they sort numbers in the correct order. They analyze and label numbers differentiating between rational and irrational numbers.
Curated OER
Picture It-Fractions
Third graders draw pictures of fractions and label them with the correct fractional amount.
Curated OER
Extreme Values
Students sketch a picture of what appears on a computer screen. Locate the extreme points on the pictures and label them as maxima or minima. Use the definitions of maxima and minima to explain how you identified the points indicated, if...
Curated OER
Classroom Supplies
Challenge young mathematicians to buy classroom supplies by staying within the means of a $1,000 budget. The mathematical activity provides learners with the opportunity to decide what items from the supply list would benefit a class of...
Curated OER
Graphing With Paper and Computers
Fourth graders construct bar graphs. In this graphing lesson, 4th graders create bar graphs in connection with the story, The Copycat Fish. After creating the initial graphs on paper, students use MS Excel to create graphs.
Curated OER
Concept: Points on a Grid
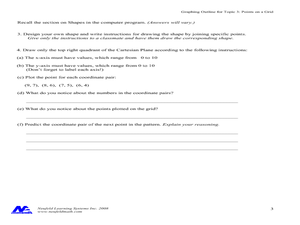
In this coordinate grid graphing worksheet, young scholars play a game of Battleship on the computer. They answer 21 questions about the coordinate grid and graphing.
Curated OER
Summer Trip
Fourth graders search for information and directions to specific cities from their homes, figure cost of trip when given miles per gallon, distance, and cost per gallon of gas, develop outline budget for summer trip, and draw and label...
Curated OER
Yummy Apples!
Students discuss apples and how they are grown. They listen as the teacher reads "Apples," by Gail Gibbons. Students discuss the story. They view several different types of apples and compare their characteristics. Students taste several...
Curated OER
Order of Operations
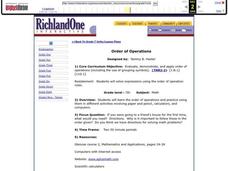
Seventh graders investigate the order of operations. In this seventh grade mathematics lesson, 7th graders explore the order of operations and practice using them in activities that involve paper and pencil, calculators and...
Curated OER
Graphing Using Excel
Fifth graders complete a series of graphs by gathering information and using Excel to graph the information. In this graphing lesson, 5th graders graph favorite desserts of the class. Student put their results into the...
Curated OER
Proteomics
Students analyze data taken from proteomic experiments. In this biology lesson, students explain the importance of bioinformatics tools in the study of proteins. They evaluate scientific results using math and computer software.
Curated OER
Performance-Based Assessment Practice Test (Grade 6 Math)
Keep track of your sixth graders' mastery of the Common Core math standards with this practice assessment. Taking a different approach than most standardized tests, this resource includes not only multiple choice questions, but also...


