Shodor Education Foundation
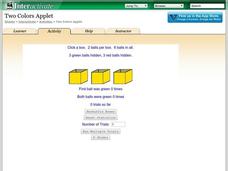
Two Colors Applet
Find the box with two green balls. The applet uses six balls, three green and three red, and hides them in three boxes. Pupils choose a box and click on it to reveal the color of balls inside. Using the chosen box, the simulation keeps...
Shodor Education Foundation
Squaring the Triangle
Teach budding mathematicians how to square a triangle with an interactive that shows a graphical proof of the Pythagorean Theorem. Pupils alter the lengths of the legs using sliders. Using the inputted lengths, the applet displays the...
Shodor Education Foundation
Pythagorean Explorer
Make sure the measurement is right. The interactive provides right triangles with a missing side measurement. Pupils use the given sides and the Pythagorean Theorem to calculate the length of the missing side. After entering the length,...
Shodor Education Foundation
Stem and Leaf Plotter
The key is in the leaves. Pupils enter data to create a stem-and-leaf plot. The resource then displays the plot and calculates the mean, median, and mode of the data. Using the plot and the calculated measures of spread, learners analyze...
Shodor Education Foundation
Skew Distribution
Slide the class into a skewed view. Learners alter the location of the median relative to the mean of a normal curve to create a skew distribution. They compare the curve to a histogram distribution with the same skewness.
Shodor Education Foundation
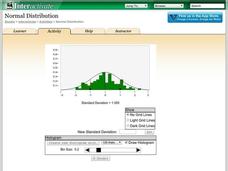
Normal Distribution
Does the size of the bin matter? The resource allows pupils to explore the relationship between the normal curve and histograms. Learners view histograms compared to a normal curve with a set standard deviation. Using the interactive,...
Shodor Education Foundation
Multi-Function Data Flyer
Explore different types of functions using an interactive lesson. Learners enter functions and view the accompanying graphs. They can choose to show key features or adjust the scale of the graph.
Shodor Education Foundation
Multiple Linear Regression
You'll have no regrets when you use the perfect lesson to teach regression! An interactive resource has individuals manipulate the slope and y-intercept of a line to match a set of data. Learners practice data sets with both positive and...
Shodor Education Foundation
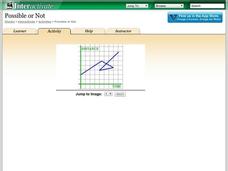
Possible or Not?
What does the graph mean? Pupils view 10 graphs and determine whether they are possible based on their contexts. The contexts are distance versus time and profit versus time.
Curated OER
Let's Play Mathematical Baseball
Students explore the concept of spelling geometric terms and words with number prefixes. In this spelling geometric terms and words with number prefixes instructional activity, students play a game of baseball. Students spell words...
Curated OER
Opinions, Please!
Students discuss the meaning and purposes of polls and surveys. After reading an article, they analyze the results of a poll given to residents of New York City. They create a survey of their own and analyze the data to write a written...
Curated OER
Teaching and Learning Through Objects
Students identify and interpret the function, usefulness or utitlity, form, beauty or aesthetics, and meaning, context or story, of objects and how they learn new skills and make things that they learn traditionally, by observation and...
Curated OER
Fraction Conversion 2 (With Percents)
Fifth graders determine how to convert fractions, decimals, and percents. In this conversion lesson, 5th graders use an on-line applet to practice making these conversions. They review how to make the conversions in a whole class lesson...
Curated OER
Gateway
Students practice listening to math problems in a foreign language. In this number sentence lesson, students listen to the teacher ask them a question in a foreign language that has some type of number combination for an answer....
Curated OER
What is a Tangram?
Students identify a tangram. In this geometry lesson, students read Grandfather Tang's Story and retell each story using the tangrams on a flannel board. Students use tangrams to complete an included worksheet.
Curated OER
Dividing Integers
In this dividing integers worksheet, students complete word problems and regular division problems. Students complete 12 division problems and 4 word problems.
Curated OER
Fractals and the Chaos Game
Students explore the concept of fractals. In this fractals lesson plan, students play the "Chaos Game" via an applet. Students place dots on the screen to recognize that they have created Sierpinski's Triangle.
Curated OER
Elapsed Time Two
Students study how to calculate elapsed time. In this elapsed time instructional activity, they determine how to calculate the ending time of an event when they are given the starting time and the elapsed time. They participate in direct...
Curated OER
Weight-The Metric System
In this metric system weight worksheet, students answer a set of 10 multiple choice questions. Students may click on a link to view correct answers or print page.
Curated OER
Census Sensibility
Young scholars examine the importance of the census and census data collection methods. They gather statistical data, create graphs comparing state and national populations, and compose written reflections on why the census is necessary.
Curated OER
Venn Diagram and Shape Sorting Lesson Plan
Students use Venn diagrams to represent classifications of shapes and to use counting arguments to find the number of objects in a given set.
Curated OER
Measurement Via Triangulation
Students investigate various common terms of measurement, sort them into categories, select the uncommon terms, and construct conversion tables for both the common and the uncommon terms of measurement.
Curated OER
Where Have All the Endangered Gone?
Students explore animals that are endangered. They choose an endangered animal that they would like to keep from becoming extinct. Students create a persuasive presentation to persuade someone to understand why they feel keeping their...
Curated OER
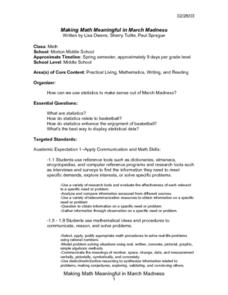
Making Math Meaningful in March Madness
Pupils examine the statistics of March Madness, the college basketball tournament. They watch videotaped basketball games to collect data for further analysis using Word and Excel. They analyze the data in a variety of activities during...


