Curated OER
Climate Comparison
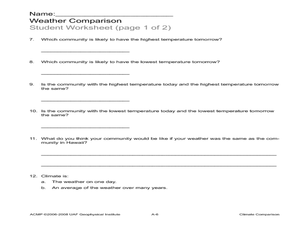
Learners explore climate regions. In this climate lesson, students examine the climate regions of Alaska as well as the state of Hawaii. Learners research selected Internet sources to gather information regarding the climates present in...
Curated OER
El Tiempo Pretérito
What tense do you use to express actions that both began and ended in the past? El tiempo pretérito, of course! Review this reference guide with your beginning Spanish speakers to provide them with the basic information for forming the...
Curated OER
Water -- Here, There and Everywhere
Students compare quantities of water. In this water lesson students examine the hydrologic cycle looking for the amount of fresh water that is available. Students use information from charts and diagrams.
Baylor College
Body Mass Index (BMI)
How do you calculate your Body Mass Index, and why is this information a valuable indicator of health? Class members discover not only what BMI is and practice calculating it using the height and weight of six fictitious individuals, but...
Curated OER
Applied Science - Science and Math Lab
Students make a prediction. In this applied science lesson, students guess the number of items in a jar. Students create a bar graph to show the predictions and the actual amounts.
Curated OER
Making Informed Decisions
Students discuss various issues of importance in the 1998 congressional and gubernatorial elections, create comparison charts of their states' candidates' positions on these issues, and decide which candidate they would vote for based on...
Conneticut Department of Education
Instructional Strategies That Facilitate Learning Across Content Areas
Imagine 28 instructional strategies, appropriate for all subject areas and all grade levels. Directed Reading-Thinking Activities (DRTA), Question-Answer Relationship (QAR) activities, KWL charts, comparison matrixes, classification...
Curated OER
World War I
Using maps, diagrams, and lists, this resource is a wonderful way to review the main concepts involving WWI. There are charts with a comparison of imperialism and nationalism, and other key ideas that explain how Europe plunged into this...
Curated OER
A Weave of Woods
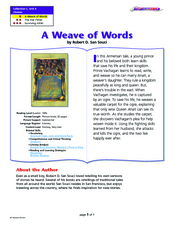
Focus on vocabulary, comprehension, and analysis while reading A Weave of Woods, a colorful picture book by Robert D. San Souci. Young learners use worksheets to preview, predict, practice paraphrasing, and make comparisons. The richly...
Math Mammoth
Comparing Decimals - mathmammoth.com
Part lesson, part worksheet, this handout walks math minors through the comparison of two decimal numbers. It teaches them the trick of tagging zeroes in to get the numbers to be the same length to better understand place value. A set of...
Curated OER
Introduction to the National Debt
Students relate the national debt to the economy. In this algebra lesson, students discuss what the national debt is, create a national budget based on priority and what the government should spend money on. They analyze their findings...
Curated OER
The Final Analysis: Cause and Effect, Fact and Opinion
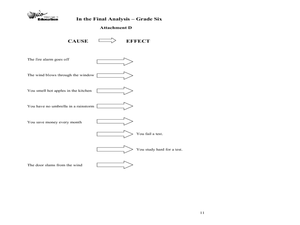
Middle schoolers read and review informational texts, analyze cause and effect, and distinguish fact from opinion. They assess a "one-minute mystery" you read aloud for cause and effect relationships. Resource includes complete set of...
Earth Day Network
The Neolithic Revolution
With the abundance of food products we can easily access in our society today, it is easy to forget the toll this can take on our global environment. Young learners will discover how the transition to agriculture and domesticated living...
Willow Tree
Circle Graphs
Pie isn't just for eating! Scholars learn to create pie charts and circle graphs to represent data. Given raw data, learners determine the percent of the whole for each category and then figure out the degree of the circle that percent...
Radford University
Sleep and Teen Obesity: Is there a Correlation?
Does the number of calories you eat affect the total time you sleep? Young mathematicians tackle this question by collecting their own data and making comparisons between others in the class through building scatter plots and regression...
Curated OER
Country Superlatives Quiz
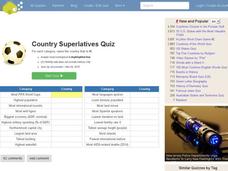
In this online interactive geography quiz instructional activity, students respond to 20 identification questions regarding world country comparisons. Students have 4 minutes to complete the quiz.
Curated OER
Chart Reading - Uninsured in the United States of America
In this chart reading learning exercise, students click on the links to read different charts about health insurance in the United States and then answer short answer questions about it. Students complete 7 questions total.
Curated OER
December Holidays:Create A Comparison Chart
How are Christmas, Chanukah, Kwanzaa, Las Posadas, and Ramadan similar? How are they different? Learners research the different December holiday celebrations around the world and compare the dates, symbols, countries, foods, and stories...
Curated OER
Trends of Snow Cover and Temperature in Alaska
Students gather historical snow cover and temperature data from the MY NASA DATA Web site. They compare this data to data gathered using ground measurements from the ALISON Web site for Shageluk Lake. They graph both sets of data and...
Curated OER
Things That Make Britain Great
Take a trip to Great Britain with this fun reading lesson! Young learners read an article about many famous attributes of Britain - 101 of them, to be exact - and finish several comprehension and grammar activities about what they have...
Curated OER
Chapter 17: Economic Growth and the New Economy
Is economic growth necessary to remain a relevant world power? These slides discuss the definition and implications of growth economics, complete with global comparisons and ways to account for growth. Graphs and charts are easy to read...
Curated OER
Compare and Chart the Stories
Elementary schoolers engage in a literature study. They make comparisons of two different versions of a story using a graphic organizer. Using the text and pictures elementary schoolers investigate three elements from the story. Then,...
Curated OER
Elementary Statistics in Life
Students examine newspapers for graphs. They collect and sort data that is of interest to them. They enter data into a database and make comparisons using the information.
Curated OER
Molecular Biology and Primate Phylogenics
By counting differences in amino acids, biology stars examine the relationships between different primates. With information gleaned, they map out a phylogenic tree and discover common ancestry. You will need to create printable versions...


